Taking the long view: At the Bank of England
The Old Lady of Threadneedle Street, as Britain’s Central Bank is fondly known, was founded in 1694 but only moved to its current premises in 1734. Public subscription had raised £1.2 million and it was open for business as the government’s banker and debt manager. But a recent working paper from current bank staff looks back very much further, in fact it looks back 800 years!
Staff Working Paper No. 686, written by Paul Schmelzing, a visiting scholar at the Bank of England from Harvard University, he more usually focuses on twentieth century financial history. As his starting point, he takes economist Eugen von Böhm-Bawerk’s (1851-1914) statement, ‘the cultural level of a nation is mirrored by its interest rate: the higher a people’s intelligence and moral strength, the lower the rate of interest’. By my reckoning, people all over the world have grown cleverer as yields across the globe are at or close to record lows.
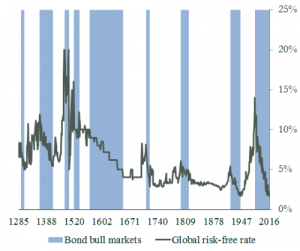
His paper looks at the annual risk-free interest rate on bonds in both nominal and real terms, from the Venetians in 1273 through to 2017. Taking data from all sorts of sources, he divides up history into segments when one nation was at its most powerful. Genoa from 1340 to 1408, then back to Venice until 1509 when Spain takes over until 1599 or so. Then Amsterdam becomes the most powerful financial centre until 1703 when the UK steps up, ironically with King William and Queen Mary. The twentieth century has been dominated by the United States with Germany briefly making an appearance in 1908-1914 and again in the 1961-1981 with the revaluation of the Deutschmark.
He then compares bond bull markets, their length and how large the drop in yields were, and the subsequent reversals. He looks in more detail at rate rises over the most recent 100 years and concludes that those which were caused by rising inflation inflicted the longest and most intense losses on investors. Finally, he tries to assess the path out of what has been an environment of falling bond yields since 1981. Because of the ultra-low rates on many bonds, some of which carry negative yields, many feel we are in a ‘bond bubble’. Mr Schmelzing concludes that a vicious US 1960’s style back up in bond yields is a distinct possibility.
Do look at the wonderful charts in their link below.
http://www.bankofengland.co.uk/research/Documents/workingpapers/2017/swp686.pdf
Tags: Bond Reversals, Financial History, Risk-Free Rate, VaR Shock, Yields
The views and opinions expressed on the STA’s blog do not necessarily represent those of the Society of Technical Analysts (the “STA”), or of any officer, director or member of the STA. The STA makes no representations as to the accuracy, completeness, or reliability of any information on the blog or found by following any link on blog, and none of the STA, STA Administrative Services or any current or past executive board members are liable for any errors, omissions, or delays in this information or any losses, injuries, or damages arising from its display or use. None of the information on the STA’s blog constitutes investment advice.
Latest Posts
- Avoid Revenge Trading: The Key to Long-Term Trading Success March 31, 2025
- Mastering Relative Strength Portfolios: Key Takeaways from the March STA Meeting March 12, 2025
- Stay Disciplined, Stay Profitable February 26, 2025
- Understanding Price Gaps in Trending February 19, 2025
- Key Takeaways from a Fireside Chat with Perry Kaufman February 12, 2025


Latest Comments