Framing and tunnel vision: How do you see gold?
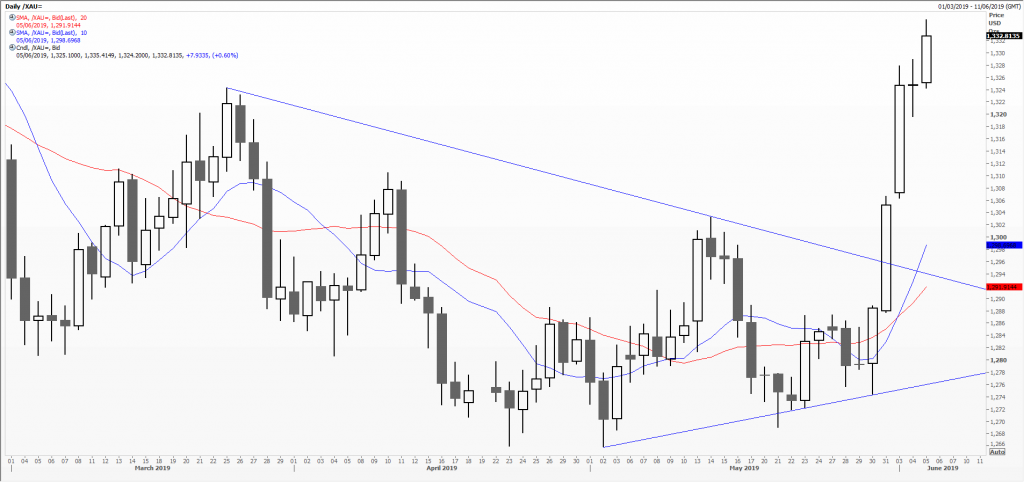
Gold bugs are probably a happy bunch this month, as suddenly the spot price of the precious metal on the wholesale markets has perked up considerably. Not surprising really, what with Trump tariffs, trade wars, sagging stock markets and shrivelling GDP. The first chart is a daily one of the price per ounce in US dollars, the way we in the West tend to think of it, and how it is usually written up in the media. The clear change in tone since late May, after some rather lacklustre moves starting March, can be seen.
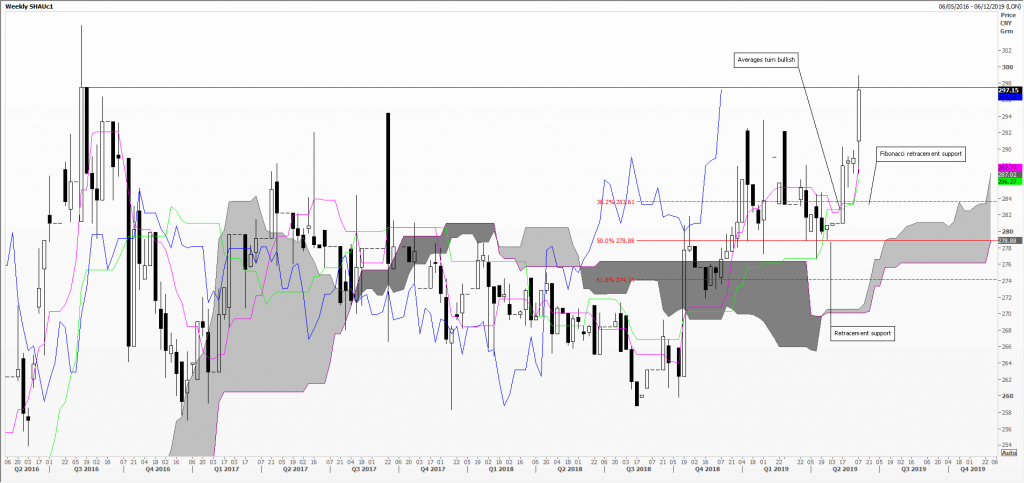
Now compare this to the second chart, a weekly one of the price of the front month contract traded on Shanghai’s Futures Exchanged, priced as yuan per gram. Here you see the spurt higher started mid-April, kicking in more strongly mid-May – linked to yuan weakness. Its managed to match 2016 levels at long last, and might well struggle at the psychological 300-yuan area. Worth noting that 305 yuan is the 50 per cent retracement since 2011’s record high at 398.68 – just below the psychological 400 yuan.
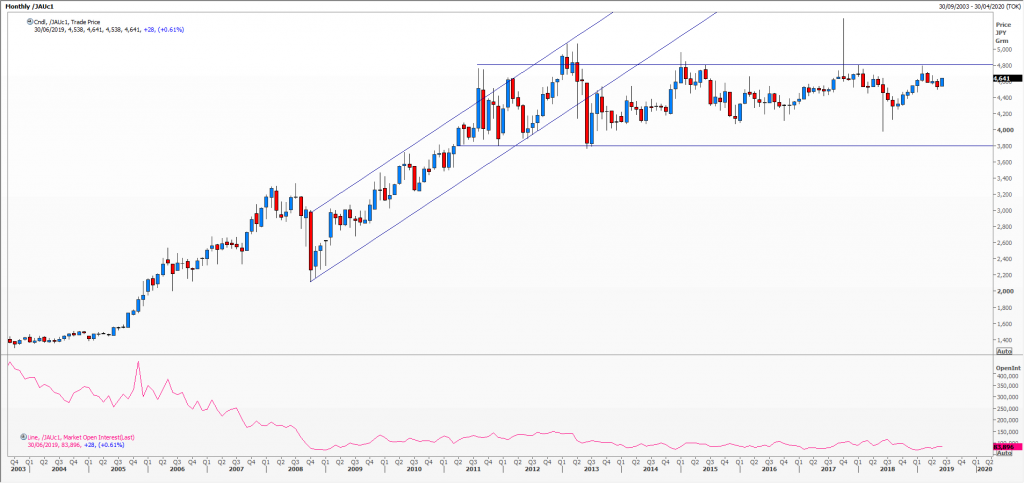
Our third chart is a monthly one, again of the front month futures contract on the Tokyo Commodity Exchange, priced as yen per gram. In May prices dropped a little, recovering early June, both moves utterly unworthy of mention. Trading clearly within the horizontal band established from 2011, open interest plotted along the bottom shows how steadily investor attention in this asset class has waned since 2005. Obviously recent yen strength has played a part.
Tags: gold, Gram, Ounce, Technical Analysis Course, Yen, Yuan
The views and opinions expressed on the STA’s blog do not necessarily represent those of the Society of Technical Analysts (the “STA”), or of any officer, director or member of the STA. The STA makes no representations as to the accuracy, completeness, or reliability of any information on the blog or found by following any link on blog, and none of the STA, STA Administrative Services or any current or past executive board members are liable for any errors, omissions, or delays in this information or any losses, injuries, or damages arising from its display or use. None of the information on the STA’s blog constitutes investment advice.
Latest Posts
- The High-Performance Trader Learning Programme: Elevating Trading Excellence December 13, 2024
- Developments in Technical Analysis: Incremental improvements November 27, 2024
- Seasonality, Cyclicals and Statistics: Probability rules! November 13, 2024
- Atlas of Finance: Mapping the Global Story of Money November 5, 2024
- Have Central Banks tamed inflation? Or are they to blame for the whole fiasco? October 23, 2024


Latest Comments