When is parabolic too much? Answer: when it suddenly reverses
Charts for this piece: Tesla, Virgin Galactic (Zero Hedge), palladium, Argentine new bond prices as IMF negotiates, Lebanese bond yields 1000%.
Media outlets – and not just financial ones – have been getting terribly excited about the share price of US electric vehicle-maker Tesla. Admittedly the firm has stolen a march over its competitors, and Mr Musk has an army of ardent fans who almost believe he’s a visionary who can walk on water. But at the heart of speculation is whether, and how quickly, can his shares hit the $1,000 mark. Price action recently has been almost vertical – with a sharp stumble here and there. Cassandras, predictably, are saying it’ll end in tears.
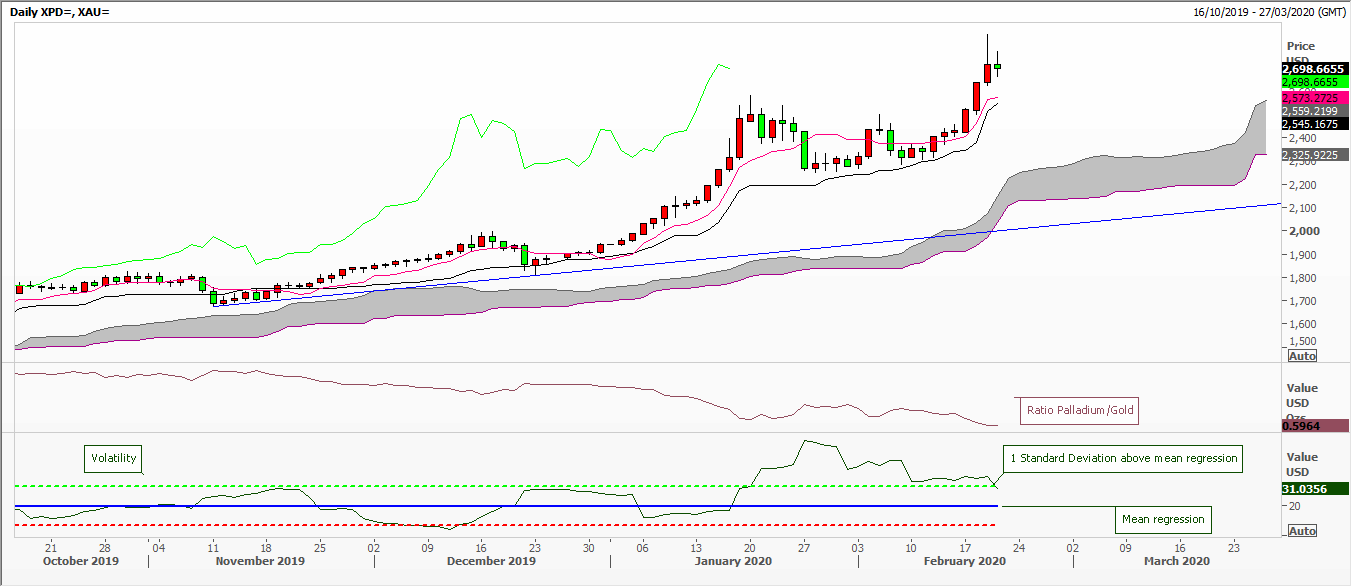
Another market on a tear is the price of palladium, where the daily chart shows just how much bullish momentum has built over the last year or so and how, because price action has been pretty much one-way, historical volatility is low. Actually, this platinum group metal (PGM) saw something similar at the start of this decade when a US auto-manufacturer tried to corner the market.
All well and good, but can we get a parabolic move in a bear market? Obviously, the closer we get to zero, room for price declines shrivel – while ironically percentage losses swell. Companies can file for bankruptcy protection or go to the wall. Commodities can hit rock bottom – and I’m not talking so-called ‘hard’ commodities.
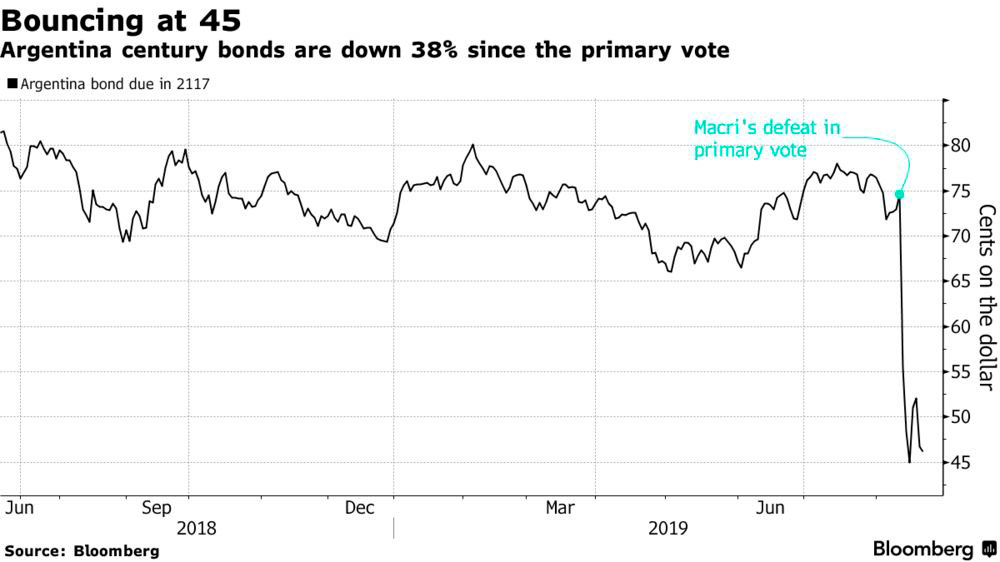
However, the fixed income market is a good place to see how parabolic moves work because, as print journalists insist on reminding us, ‘as bond prices fall, yields rally – and vice versa’. In the news again this week as the IMF hits Buenos Aires to see about yet another restructuring of sovereign debt, we remind that in the summer of 2018, Christine Lagarde, as head of the IMF, signed off its biggest ever loan – $56 billion – to this serial defaulter. Maybe not so silly, because in 2017 Argentina had managed to raise a US dollar 100-year sovereign bond – admittedly with a hefty coupon of 8 per cent, if I remember. Things went pear-shaped last year when the first round of presidential elections went badly for incumbent Macri. The chart below shows how the price of these bonds reacted. Blink and you missed it. Scarier still: I’m told that Lebanon’s sovereign debt yields about 1000 per cent this week as the IMF pays a visit.
That’s the risk of ‘irrational exuberance’.
Tags: Excess, momentum
The views and opinions expressed on the STA’s blog do not necessarily represent those of the Society of Technical Analysts (the “STA”), or of any officer, director or member of the STA. The STA makes no representations as to the accuracy, completeness, or reliability of any information on the blog or found by following any link on blog, and none of the STA, STA Administrative Services or any current or past executive board members are liable for any errors, omissions, or delays in this information or any losses, injuries, or damages arising from its display or use. None of the information on the STA’s blog constitutes investment advice.
Latest Posts
- Navigating the Market: Insights from Robin Griffiths and Ron William April 9, 2025
- Avoid Revenge Trading: The Key to Long-Term Trading Success March 31, 2025
- Mastering Relative Strength Portfolios: Key Takeaways from the March STA Meeting March 12, 2025
- Stay Disciplined, Stay Profitable February 26, 2025
- Understanding Price Gaps in Trending February 19, 2025


Latest Comments