‘What does the inflation crisis mean for you?: Wednesday’s presentation from Santander Bank
Every now and then a really good virtual presentation comes your way – except the STA and IFTA ones which are, of course, always good and worth making an appointment to view. An invitation to a weekday half hour slot courtesy of the UK branch of the Spanish bank that uses Ant and Dec to promote its services? Why not, coming from their Wealth Management and Insurance arm (WM&I) – I thought the moniker smacked of NS&I (National Savings and Insurance) – so I wanted to see what they were up to.
Timely and well produced, the key speaker was Chris Payne, Prices Production Head (I do hope I’ve got his title correct) and one of two statisticians tasked with calculating the UK’s inflation figures for the Office of National Statistics (ONS). An absolute tour de force with clear slides, well-rehearsed commentary and delightful insights.
The ONS are the UK’s largest independent producer of official statistics. They are responsible for collecting and publishing statistics related to the economy, population and society at national, regional and local levels. They also conduct the census in England and Wales every 10 years.
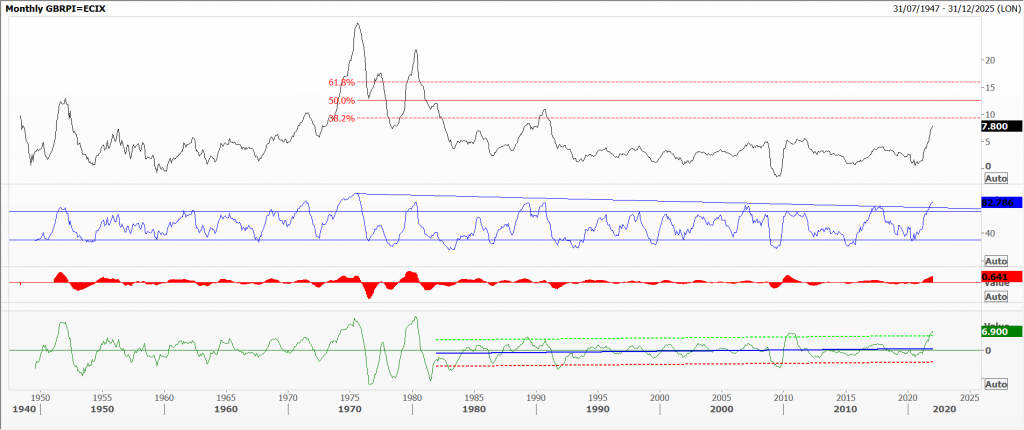
But did you know that real humans collect the data, more often than not using smartphones? (They photograph the prices displayed on shelves and labels). That they have four different measures for UK inflation and are constantly updating the typical basket of goods? That Retail Price Inflation, considered a legacy measure because it’s been collected since 1947 and used for calculating the interest on index-linked Gilts, is the reason that the cost of servicing UK government debt was the highest ever in January 2022 (£6.1 billion) because RPI was 7.8% over the last 12 months.
The Consumer Prices Index lies at 5.5% as widely reported by the newspapers, and is the one used for benefits, state pensions and monetary policy (where the target over the medium term is 2.0%). CPIH, which includes housing costs (as does RPI but not CPI) is running at 4.9% per annum is their preferred measure.
Another measure calculates the Owner Occupiers’ Housing costs (OOH), a measure used widely in the United States. The ONS is also in the process of developing a new measure called HCI (Household Consumer Inflation) where OOH is included and more weight is given to items we need and spend most on.
They admit that some things are hard to gauge accurately, like end-of-line sales and buy-one-get one-free offers. Likewise technology items where it is difficult to adjust for changes in quality. Most difficult of all, and never included in any basket, are the cost of items that might threaten their staff. They call these ‘out of scope’ and include narcotics. All in a day’s work, as they say.
I include a pdf version here, of their post on the latest inflation data taken from their website.
Tags: annualised, data, inflation, monthly charts
The views and opinions expressed on the STA’s blog do not necessarily represent those of the Society of Technical Analysts (the “STA”), or of any officer, director or member of the STA. The STA makes no representations as to the accuracy, completeness, or reliability of any information on the blog or found by following any link on blog, and none of the STA, STA Administrative Services or any current or past executive board members are liable for any errors, omissions, or delays in this information or any losses, injuries, or damages arising from its display or use. None of the information on the STA’s blog constitutes investment advice.
Latest Posts
- Avoid Revenge Trading: The Key to Long-Term Trading Success March 31, 2025
- Mastering Relative Strength Portfolios: Key Takeaways from the March STA Meeting March 12, 2025
- Stay Disciplined, Stay Profitable February 26, 2025
- Understanding Price Gaps in Trending February 19, 2025
- Key Takeaways from a Fireside Chat with Perry Kaufman February 12, 2025


Latest Comments