How to cope with holidays: All year around
I’m not going to resort to the usual media drivel to pad out a lean time for news. Nor am I going to tell you sanctimonious stories about dealing with too much food, the ‘outlaws’ and competitive parlour games. I’m going to ask you to properly – and seriously – consider how your charts are drawn.
With the coming of cheap, and often free, computer chart packages it’s all too easy to call up a graph of X, Y or Z instrument, cast a quick glance over it, and assume you’ve got a grip on the subject. Now, please stop a minute and deconstruct this sentence. Cheap or free – can you trust the data? Most exchanges levy hefty fees for access to their prices. Where are prices being harvested and is the source reliable? Is it delayed data? Will these be the prices that other traders are seeing? As you can see, there are lots of pitfalls before you even start with technical analysis.
Then: what constitutes a day? Working in London I’m lucky in that I am on Greenwich Mean Time (plus an hour in summer). This happens to be very roughly half-way between Asia and The Americas trading times. I have also been lucky to use Reuters/Refinitiv feeds where I choose exactly the hours of what is my ‘day’. So at the beginning of the week I stretch it out to Sunday night GMT so that I can catch New Zealand and early Japan opening times. Likewise at the end of the day, I tend to choose the Chicago, not New York, closing bell, ignoring anything happening in California.
What is a week? As you can see from above, it’s not exactly Monday to Friday. Remember that many exchanges – and big businesses – used to work on Saturday mornings, so historical charts are not strictly comparable. When is the weekend? Many North African and Middle Eastern countries stop work on a Friday and have leisure time on a Saturday. All of this affects the number of working days in a month and a year.
To this confusion, to the mixing bowl add selective festive work-free days, many of which are exclusive to only one nation. From a quick net-based search I learn that Myanmar has about 30 public holidays per annum, and India 21; I know that Madrid in Spain has an awful lot too. Switzerland has the fewest public days off which, depending on the canton, may mean as few as 7; England and Wales are close on its heels with 8 days.
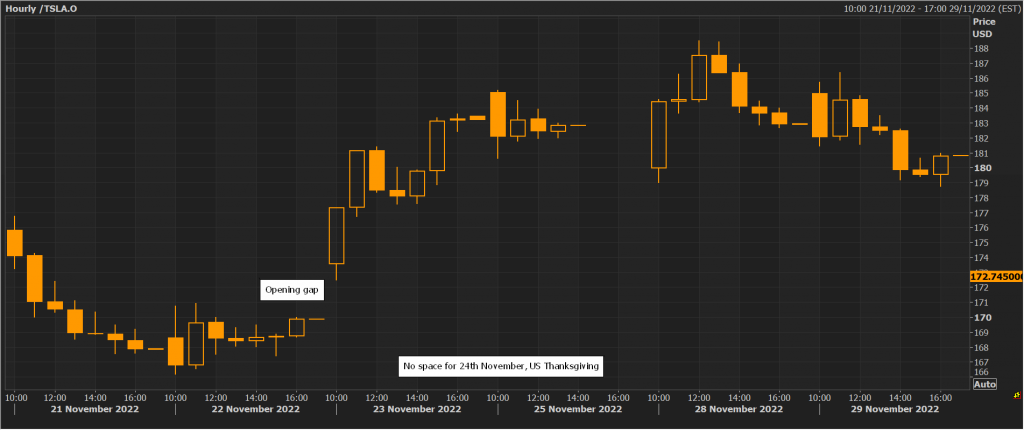
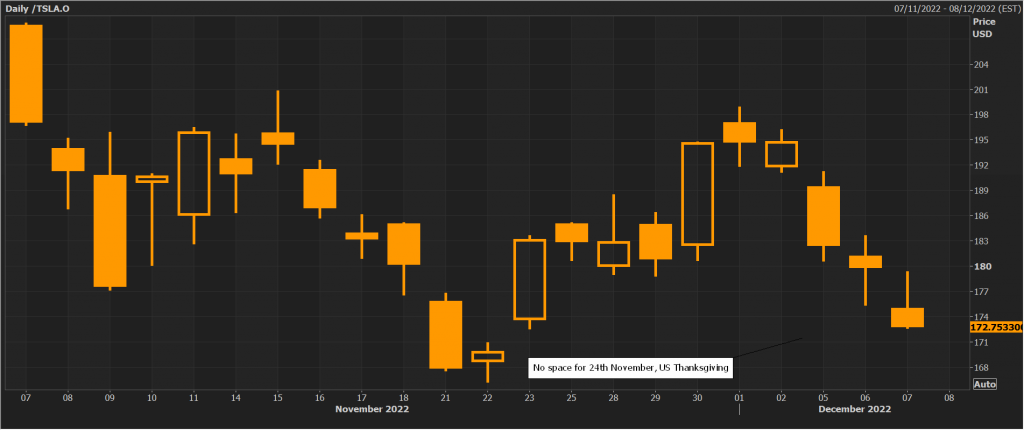
All of the above matters when calculating any oscillator. Convention has it that when drawing a chart a gap is left to mark a public holiday (drawing manually brings focus to the issue). All trend lines are affected. It will also mean that people in other parts of the world will not be looking at the same picture as you are.
Caveat emptor!
Tags: days in a week, gaps, hours in a day
The views and opinions expressed on the STA’s blog do not necessarily represent those of the Society of Technical Analysts (the “STA”), or of any officer, director or member of the STA. The STA makes no representations as to the accuracy, completeness, or reliability of any information on the blog or found by following any link on blog, and none of the STA, STA Administrative Services or any current or past executive board members are liable for any errors, omissions, or delays in this information or any losses, injuries, or damages arising from its display or use. None of the information on the STA’s blog constitutes investment advice.
Latest Posts
- The High-Performance Trader Learning Programme: Elevating Trading Excellence December 13, 2024
- Developments in Technical Analysis: Incremental improvements November 27, 2024
- Seasonality, Cyclicals and Statistics: Probability rules! November 13, 2024
- Atlas of Finance: Mapping the Global Story of Money November 5, 2024
- Have Central Banks tamed inflation? Or are they to blame for the whole fiasco? October 23, 2024


Latest Comments