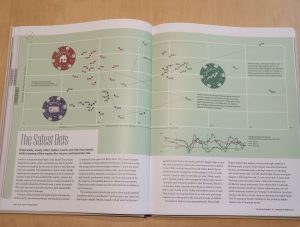
Atlas of Finance: Mapping the Global Story of Money
 I recently read a book review by Jonathan Guthrie in the FT Weekend about this book. He starts: ‘In pirate fiction, maps disclose the location of hidden riches’ and continues ‘a good chart is often worth a thousand words or numbers. The trump card of the graphic is an ability to show scale’. Coupled with a great large illustration, as a visual person I was hooked and rushed off to buy the book. Printed this year by Yale University Press I was lucky my local bookshop had it in stock. (Recently I’ve had trouble buying some US published texts in London).
The author is listed as Dariusz Wójcik, but in reality he is has collated the work of eight post-doctoral researches, plus input from 200 Oxford student interns with a grant from the European Research Council. In hisintroduction he notes: ‘Due to its paradoxical nature, most people consider money and finance arcane, something to leave to the experts and  technocrats, economists and bankers. Such an attitude is not only unhelpful but also dangerous.’ The real stars of the show however are cartographer James Cheshire and graphic artist Oliver Uberti for whose work Wójcik coins the term ‘finviz’ – financial visualisation, which harnesses geography, cartography and data visualisation. The background of the researchers reflect these subjects and also include two economists, two professionals from the financial sector, a sociologist and a political economist.
He continues, ‘the financial industry have long been obsessed with charts of fluctuating prices, but they have largely eschewed the broader patterns and impacts of finance’. This is the book’s aim. Divided into eight chapters: History and Geography; Assets and Markets; Investors and Investments; Intermediation and Technology; Cities and Centers; Bubbles and Crises; Regulation and Governance; Society and Environment.
A hardback a little shorter and wider than a sheet of A4 paper, I can imagine reading it together with a child, poring over the details, colours and discussing the developments of finance as compared to its uses today. Start them young!
Tags: display, Graphics, scale, visualisations
The views and opinions expressed on the STA’s blog do not necessarily represent those of the Society of Technical Analysts (the “STA”), or of any officer, director or member of the STA. The STA makes no representations as to the accuracy, completeness, or reliability of any information on the blog or found by following any link on blog, and none of the STA, STA Administrative Services or any current or past executive board members are liable for any errors, omissions, or delays in this information or any losses, injuries, or damages arising from its display or use. None of the information on the STA’s blog constitutes investment advice.
Latest Posts
- Navigating the Market: Insights from Robin Griffiths and Ron William April 9, 2025
- Avoid Revenge Trading: The Key to Long-Term Trading Success March 31, 2025
- Mastering Relative Strength Portfolios: Key Takeaways from the March STA Meeting March 12, 2025
- Stay Disciplined, Stay Profitable February 26, 2025
- Understanding Price Gaps in Trending February 19, 2025


Latest Comments