Back with a bang! Two for one offer
I was looking forward to the STA’s first monthly meeting after the summer break. What I hadn’t expected was a sort of ‘two for the price of one’ offering, with two executive committee members, Tom Hicks and Luise Kliem on hand to introduce their areas of speciality. Ladies first, so the chief examiner of our Diploma course introduced some of the successful candidates who had passed recently; unfortunately, many were unable to attend as they live abroad.
 Of the roughly 100 candidates sitting Part 2, ‘‘an extremely challenging exam’’ as Luise describes it (and I’d agree having sat it myself) the pass rate was about 70 per cent. Just 2 distinctions were merited, giving you a clue as to how well these chaps had done: Justin Gray and Andrew Swinhoe. Certificates and a photo op with chairman Axel Rudolph; then on to the other successful candidates: William Broad, Arjun Lakhanpal, Stefan Majewski, Joseph Stein, and Adam Stobbs – who all got the same treatment. Well done chaps!
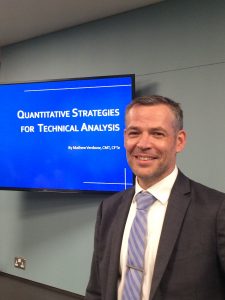
Tom then introduced our speaker, Mathew Verdouw CMT CFTe of Optuma. He had kindly given me his business card, with many international phone numbers, but I pass on his email address – MathewV@optuma.com – in case you’d like to get in touch. His topic: Quantitative Strategies for Technical Analysis. He’s spent 20 years building trading systems and he trains traders. He correctly explains, ‘’in an era of data science, clients are demanding validation of performance’’.
Subjective technical analysis is not enough. Three big questions arise. 1: Why test [strategies]? 2: It’s more than just back-testing. 3: Is my technical analysis adding value? With this in mind he breaks down the process into discrete steps: idea generation, signal testing, codifying the rules, trade execution, examining special cases, inspecting and maybe adding rules.
Much of his work has been working with major indices and widely held shares. I believe that because of this, he has found that success rates are nearly always based around a normal distribution – though he happily agrees that RRG analysis does not work on Russell shares because the system is based on big names mean reverting. This is key, because one must build a sample distribution to measure whether one’s strategy adds value. He also stresses the importance of randomising one’s start date and security, so that under scrutiny we can pick it apart. He also tries to eliminate major market trends, therefore studied the S&P 500 between 2002 and 2009, a period of 2 bear markets and 2 bulls.
I’d tend to back his idea that, in today’s big data world, ‘’for technical analysis to survive, it must be more quantitative’’.
Tags: Back-Testing, Big Data, Normal Distribution, Tails
The views and opinions expressed on the STA’s blog do not necessarily represent those of the Society of Technical Analysts (the “STA”), or of any officer, director or member of the STA. The STA makes no representations as to the accuracy, completeness, or reliability of any information on the blog or found by following any link on blog, and none of the STA, STA Administrative Services or any current or past executive board members are liable for any errors, omissions, or delays in this information or any losses, injuries, or damages arising from its display or use. None of the information on the STA’s blog constitutes investment advice.
Latest Posts
- Navigating the Market: Insights from Robin Griffiths and Ron William April 9, 2025
- Avoid Revenge Trading: The Key to Long-Term Trading Success March 31, 2025
- Mastering Relative Strength Portfolios: Key Takeaways from the March STA Meeting March 12, 2025
- Stay Disciplined, Stay Profitable February 26, 2025
- Understanding Price Gaps in Trending February 19, 2025


Latest Comments