Can you handle rejection? And do you even know when it’s happened?
The teenage girlfriend two-timed you; your friends will tell you soon enough. Your lover ghosted you; it could take a while to get to grips with what’s going on. You were blackballed by your club or cancelled by your gang; it’s obvious. None of these are welcome situations, but what if lousy financial investments were as clear as these social situations in telling you that you’ve backed the wrong horse?
The stockbroker who recommended the trade in the first place is unlikely to be uncertain about what to do next; think phrases like ‘buy the dip’. The psychological angst when crystallising losses may well prevail. Loss of face among the trading community can be a big motivator. The charts and technical analysis of these may be clearer and more immediate source of reliable information.
I bring this up this week because March 2022, and to a lesser extent February, have seen some markets suffer a very serious knock-back following extreme market moves. The combination of these two is more important than a move in any one direction. At extremes, technical analysts will watch for
a series of warning signs. High historical and implied volatility – and good volume too. Oscillators at extremes or even signs of complacency. Media hype and consensus opinion clustering around narrow parameters and forecasts. Above all, the idea that it must happen because everyone says it will. Caveat emptor.
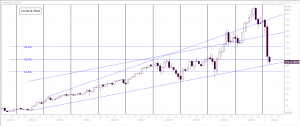
One of the biggest falls, in a very short time, that I have witnessed in my 40 years of trading was Moscow’s MOEX index, down 56% since January’s high (not the all-time high at 4078 in October 2021). The latest news is that the exchange will be closed until at least March 18th. This is not an emerging market or Ukraine-linked phenomenon; Facebook (now Meta) is off $199 from
September 2021’s record high, to just $185 this week, retracing over half of its rally since 2012 – ten years’ work of this tech titan unravelled in a few months.
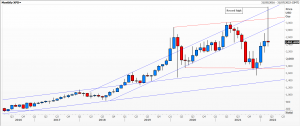
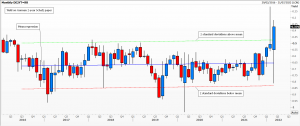
Other moves may be dramatic but not quite as clear. Moves in crude oil, which at the time of writing is forming a potential very large spike high on the monthly chart. Spot palladium has suffered from extreme volatility for many months and the picture hasn’t let up yet. The yield on 2-year German Schatz paper has had two consecutive months of swings way beyond 2-standard deviations – suggesting a market in disarray. As for London Metal Exchange nickel forwards, let’s not even go there.
Tags: Candlesticks, reversal, spike high, trend change, volume
The views and opinions expressed on the STA’s blog do not necessarily represent those of the Society of Technical Analysts (the “STA”), or of any officer, director or member of the STA. The STA makes no representations as to the accuracy, completeness, or reliability of any information on the blog or found by following any link on blog, and none of the STA, STA Administrative Services or any current or past executive board members are liable for any errors, omissions, or delays in this information or any losses, injuries, or damages arising from its display or use. None of the information on the STA’s blog constitutes investment advice.
Latest Posts
- Navigating the Market: Insights from Robin Griffiths and Ron William April 9, 2025
- Avoid Revenge Trading: The Key to Long-Term Trading Success March 31, 2025
- Mastering Relative Strength Portfolios: Key Takeaways from the March STA Meeting March 12, 2025
- Stay Disciplined, Stay Profitable February 26, 2025
- Understanding Price Gaps in Trending February 19, 2025


Latest Comments