Central Banks ahoy! How will markets react?
The media, the world and his mother are well aware that all sorts of consumer prices have been rising sharply since Q3 2021; now it’s the turn for central banks to sit up and smell the roses – and pretend they know what they’re doing and are in control. Thursday’s [5th May 2022] Bank of England 25 basis point rise to 1.00% was heavily telegraphed, yet 3 of the 9 Monetary Policy Members suggested a hike to 1.25%. The day before the US Federal Reserve had raised rates by 50 basis points, while appearing to rule out stiffer medicine. Even India joined in the fray this week and Brazil clobbered its people with a 100 basis point rate rise.
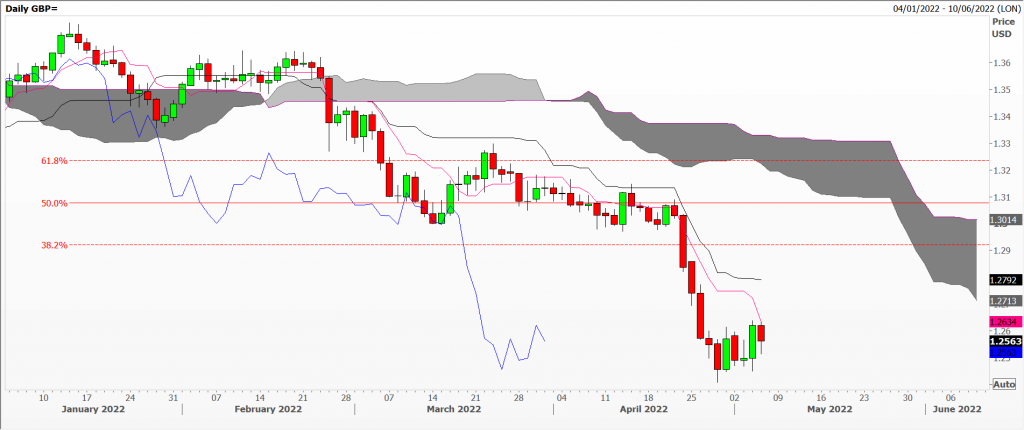
Where does all of this leave traders and investors? None the wiser, I might suggest. To dig a little deeper into today’s issues, I have 3 charts of the British pound against the US dollar. Since January this year the US greenback has strengthened against freely traded currencies, roughly to the tune of 6% against most and 12% for the weaklings, Cable (USDGBP) dropping from a high at $1.3750 in January to a low at $1.2400 late April. You can see its progress on the daily Ichimoku Cloud chart [GBP1] where all elements of this trending system remain bearish for sterling, though down moves have slowed this week.
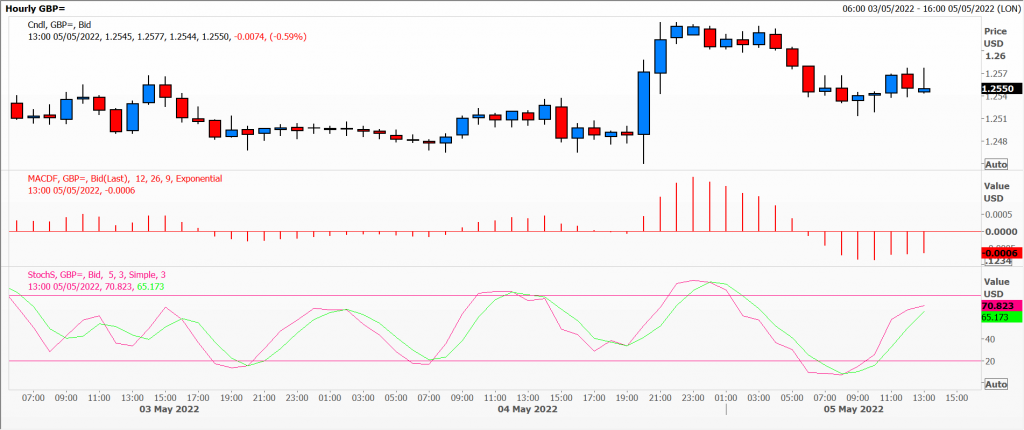
In the hours leading up to the Old Lady of Threadneedle Street’s decision, the market hovered just above the psychological $1.2500 [GBP2] level. The MACD histogram (hourly) was in negative territory most of this morning – following a post-FOMC shift overnight into positive – and Stochastics were mixed at best.
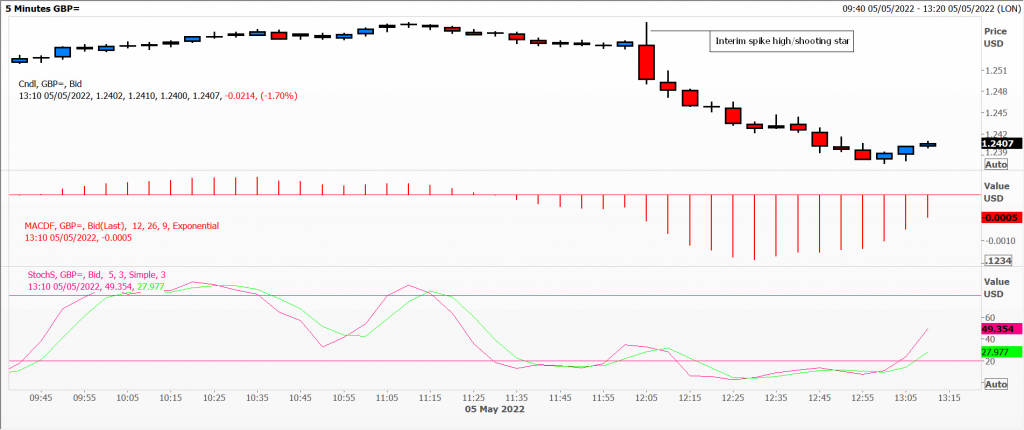
Dipping fractionally to a new intra-day low below $1.2400 on the 5-minute chart [GBP3] ahead of BoE Governor Bailey’s press conference, lack of downside follow-through saw the MACD become less bearish and the Stochastics turn positive. In this speech the Governor warned of the potential for lower economic growth this year, higher unemployment, and that real household disposable income would drop by 1.75%. In three years’ time they forecast CPI inflation should drop 1.30% based on market interest rates. So much for their modelling.
Charts courtesy of MetaStock EIKON by Refinitiv
Tags: Daily, hourly and 5-minute charts, Ichimoku, MACD, Stochastics
The views and opinions expressed on the STA’s blog do not necessarily represent those of the Society of Technical Analysts (the “STA”), or of any officer, director or member of the STA. The STA makes no representations as to the accuracy, completeness, or reliability of any information on the blog or found by following any link on blog, and none of the STA, STA Administrative Services or any current or past executive board members are liable for any errors, omissions, or delays in this information or any losses, injuries, or damages arising from its display or use. None of the information on the STA’s blog constitutes investment advice.
Latest Posts
- Navigating the Market: Insights from Robin Griffiths and Ron William April 9, 2025
- Avoid Revenge Trading: The Key to Long-Term Trading Success March 31, 2025
- Mastering Relative Strength Portfolios: Key Takeaways from the March STA Meeting March 12, 2025
- Stay Disciplined, Stay Profitable February 26, 2025
- Understanding Price Gaps in Trending February 19, 2025


Latest Comments