Coinciding with currency wars – Rebasing charts
We all know that the euro is plummeting, it’s status as the most hated currency in a long time well established. But what’s it doing relative to other currencies around the globe? When some are quoted as US dollars per unit of currency, like the euro, and others as currency per US dollar, like the Japanese yen, how can we compare this frankly motley lot?
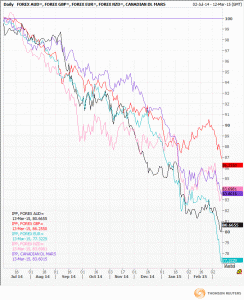
We use Rebasing charts. These compare percentage moves over a chosen time period. We have two examples here, both starting in July 2014 because that was when US dollar strength really kicked in. Both start with all currencies valued at a nominal 100 and then plot how much each has, in this case lost in value, as a per cent up until today. The first chart includes the euro (-23%), sterling (-13%), Australian )-20%) and New Zealand (-17%) dollars, plus Canadian futures prices (-17% too) as all are quoted as dollars per unit of currency. Depending on your point of view top dog is the single currency and the pound the laggard – or vice versa.
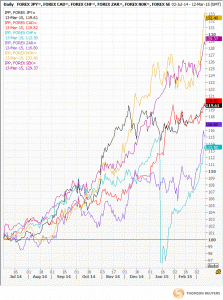
The second chart is a more diverse lot where the biggest loser, and possibly a surprise to many, is the Norwegian crown (-33%), then the Swedish one (-29%), the yen (-19%) and Swiss franc (-13%). In case you are not aware the purple line labelled ZAR is the South African rand.
This type of chart is brilliant for comparing the performance of related securities and ties in with the analysis of the speaker at last week’s STA meeting (please see video in the Meetings Video section).
The views and opinions expressed on the STA’s blog do not necessarily represent those of the Society of Technical Analysts (the “STA”), or of any officer, director or member of the STA. The STA makes no representations as to the accuracy, completeness, or reliability of any information on the blog or found by following any link on blog, and none of the STA, STA Administrative Services or any current or past executive board members are liable for any errors, omissions, or delays in this information or any losses, injuries, or damages arising from its display or use. None of the information on the STA’s blog constitutes investment advice.
Latest Posts
- Navigating the Market: Insights from Robin Griffiths and Ron William April 9, 2025
- Avoid Revenge Trading: The Key to Long-Term Trading Success March 31, 2025
- Mastering Relative Strength Portfolios: Key Takeaways from the March STA Meeting March 12, 2025
- Stay Disciplined, Stay Profitable February 26, 2025
- Understanding Price Gaps in Trending February 19, 2025


Latest Comments