


Coppock’s indicator: Mercifully, monthly only
If, like me, you have spent way too many hours, days, and years studying charts – and more often than not staring blankly at computer screens – it’s nice to know some things only have to be done very occasionally; a bit like Spring cleaning. With the start of a brand new year upon us it’s time to look at monthly, quarterly, and annual bars or candles; (pity the poor point and figure and Renko aficionados who never get a break caused by time).
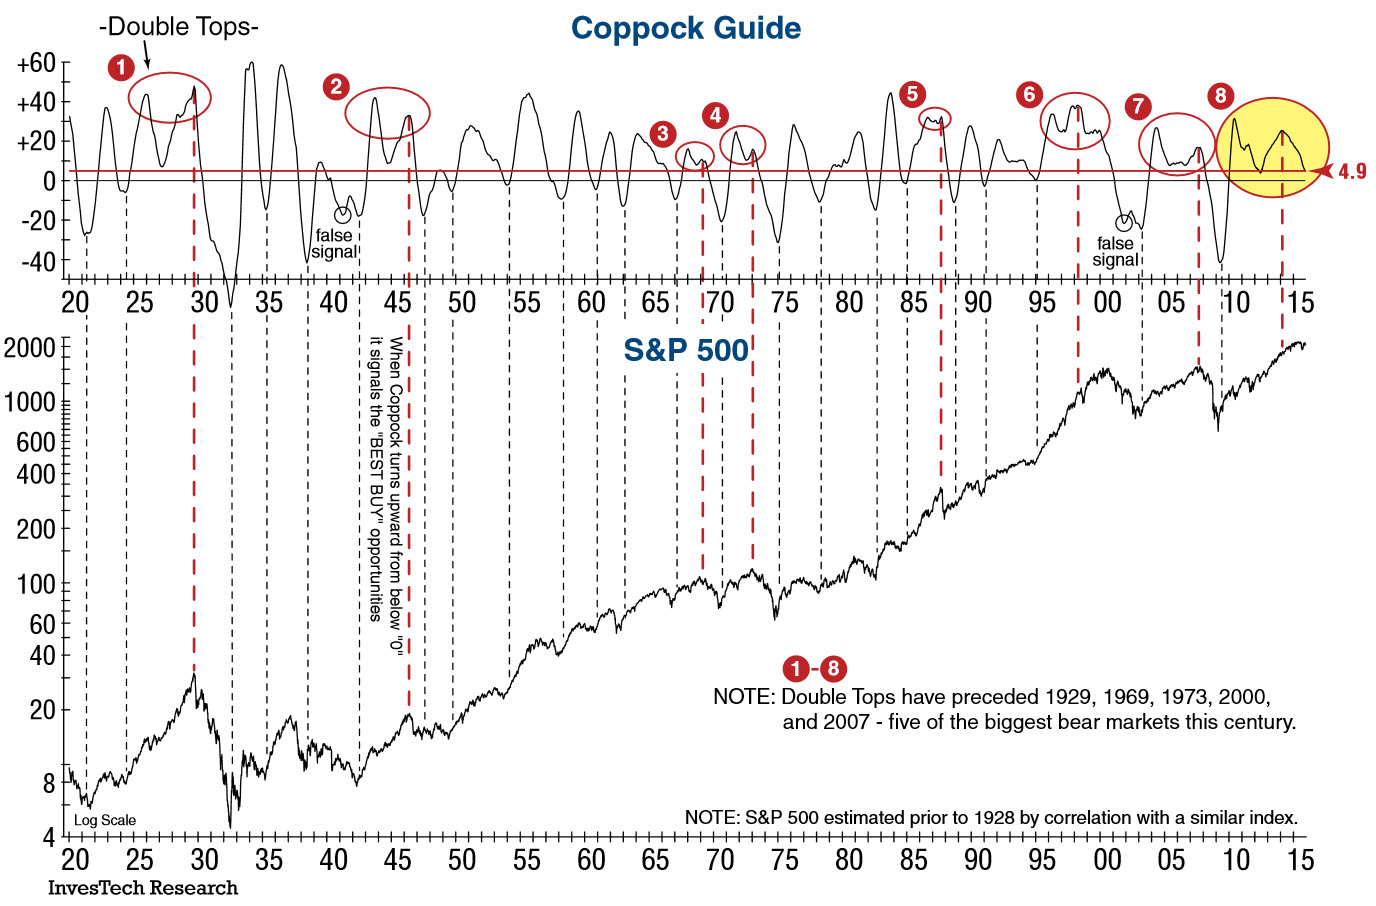
This week, as well as studying the long term candles, I have also been looking at the Coppock indicator, or ‘curve’ as it is sometimes called, because it is of great interest to retail stock market investors. They have also expanded its traditional use from company stocks to other indices, like the Commodities Research Bureau index.
Coppock, first devised by his namesake (Edwin ‘Sedge’ Coppock) in the mid-1960’s, is basically a variation of a very long term moving average system – and therefore, not surprisingly, follows trends. It is a weighted (by 10 months) moving average crossover of the 11 and 14 month rate of change (he first used the S&P 500). The unusual time periods chosen are believed to be linked to the normal period of grieving after a close death, thought to be a similar loss as a big stock market decline.
The indicator generates a ‘buy’ signal when it crosses above the zero line, forming a trough. Interestingly, it never gives a ‘sell’ signal – perhaps yet again reinforcing the stockbrokers’ tendency to bullish forecasts – though according to Wikipedia:
A slightly different version of the indicator is still used by the Investors Chronicle, a British investment magazine. The main difference is that the Investors Chronicle version does include the sell signals, although it stresses that they are to be treated with caution. This is because such signals could merely be a dip in a continuing bull market.
Many have started suggesting going short when the Coppock drops below zero, and others experimenting with a daily version of it all. I rather like the idea of doing some things once in a blue moon.
Tags: Coppock, Indices, monthly readings
The views and opinions expressed on the STA’s blog do not necessarily represent those of the Society of Technical Analysts (the “STA”), or of any officer, director or member of the STA. The STA makes no representations as to the accuracy, completeness, or reliability of any information on the blog or found by following any link on blog, and none of the STA, STA Administrative Services or any current or past executive board members are liable for any errors, omissions, or delays in this information or any losses, injuries, or damages arising from its display or use. None of the information on the STA’s blog constitutes investment advice.


Latest Comments