Designing Great Visualizations – Tableau® software
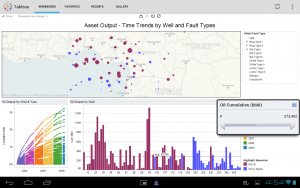
Sometimes, only rarely, does one come across something that is, as the kids would say, ‘awesome’. Being a visual sort of person, which I think most technical analysts must be, I recently came across this site and it reminded me of that beautiful book with 365 photos of views of the world by Yann Arthus-Bertrand. I’m attaching a pdf file they sent to me this month but, before you open it, let me tell you a little about its contents and the company.
Based in Seattle – how predictable! – it specialises in displaying and analysing data for business purposes. Not a technical analysis package at all, but covering the broader theme of how we handle data visually. Sometimes it’s good to step back from the coalface and think laterally, which I hope this paper might do for you. From ancient cave-dwellers’ maps, through to Mercator’s getting from A to B, to histograms and pie charts, to Bertin’s semiology and the power of computers.
Personally I found the most interesting section on page 10 where they analyse the different types of data; yes, Nominal, Ordinal and Quantative. You see, before you roll up your sleeves and tackle a graphic, it’s worth sitting back a moment and thinking of the data itself. Is it reliable? Recent? Representative? Clean? Bringing these ides back to the STA for example, are stock exchange volumes worth looking at today in the light of dark pools? Do we have enough historical data for some series, say volatility, or ETFs? Or the progress of all too many bond and equity funds?
Finally, why are economists so keen on graphs while poo-pooing technical analysis?
The views and opinions expressed on the STA’s blog do not necessarily represent those of the Society of Technical Analysts (the “STA”), or of any officer, director or member of the STA. The STA makes no representations as to the accuracy, completeness, or reliability of any information on the blog or found by following any link on blog, and none of the STA, STA Administrative Services or any current or past executive board members are liable for any errors, omissions, or delays in this information or any losses, injuries, or damages arising from its display or use. None of the information on the STA’s blog constitutes investment advice.
Latest Posts
- Navigating the Market: Insights from Robin Griffiths and Ron William April 9, 2025
- Avoid Revenge Trading: The Key to Long-Term Trading Success March 31, 2025
- Mastering Relative Strength Portfolios: Key Takeaways from the March STA Meeting March 12, 2025
- Stay Disciplined, Stay Profitable February 26, 2025
- Understanding Price Gaps in Trending February 19, 2025


Latest Comments