Developments in Technical Analysis: Incremental improvements
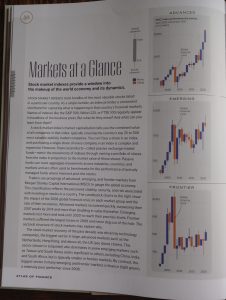
Reading through my newly purchased book, Atlas of Finance compiled by Dariusz Wójcik and published by Yale University Press, I came across these candlestick charts profiling recoveries post the 2008 stock market crash. Labelled ‘advanced’, ‘emerging’ and ‘frontier’ markets, nothing special here. Yet this is a text book with chapters on ‘investors and investments’, ‘bubbles and crises’ plus ‘regulation and governance’. Very much an economics textbookwhich some years ago would not have heard of this type of chart.
This reminded me of when I first came across candle charts; I’d started off with bar charts and point & figure ones in 1982. I’d heard of the Japanese ones in the early 1990s but had only used them religiously, and daily, since 1997. The man who brought these to the Western world was American Steve Nison who had worked at Merrill Lynch in Tokyo and, with help from his Japanese colleagues and the NTAA (Nippon Technical Analysts Association) wrote Japanese Candlestick Charting Techniques, published by Simon & Schuster in 1991. He says: ‘’In Japan, where proverbs are respected, ‘candles exhaust themselves to give light to man’ ‘’.
 But before that, in 1986, my colleagues and I at Midland Bank devoured the then relatively unknown book by Welles Wilder Jr. New Concepts in Technical Trading Systems, published in 1978 by Trend Systems. The text included, for the first time, concepts such as DMI, Parabolic SAR and RSI. Great excitement all round as we devised trading systems with this new-found knowledge.
A gentleman also at the forefront new ideas was another American, Tom DeMark. Publishing New Market Timing Techniques: Innovative Studies in Market Rhythm and Price Exhaustion in 1997 with Wiley Trading, his concept was quickly snapped up by the analytics people at the Bloomberg terminal – as they and CQG had latched onto the candles earlier on.
Another very popular concept today is Market Profile, stemming from the futures market pits where trading sessions are divided into half-hour segments.Developed by J. Peter Steidlmayer, perhaps the most useful of his many books is Trading with Market Profile, published by Wiley in 2002.
Rounding off this piece, I too introduced the West to another Japanese charting technique, Ichimoku Clouds, with my snappily titled Ichimoku Charts book published by Harriman House in 2007. Reuters had these on their system by the mid-1990s, but it was only thanks to my Japanese work colleagues that I learnt how to use them. Once again collaboration at work.
Tags: candles, Market Profile, oscillator, RSI, timing
The views and opinions expressed on the STA’s blog do not necessarily represent those of the Society of Technical Analysts (the “STA”), or of any officer, director or member of the STA. The STA makes no representations as to the accuracy, completeness, or reliability of any information on the blog or found by following any link on blog, and none of the STA, STA Administrative Services or any current or past executive board members are liable for any errors, omissions, or delays in this information or any losses, injuries, or damages arising from its display or use. None of the information on the STA’s blog constitutes investment advice.
Latest Posts
- Stay Disciplined, Stay Profitable February 26, 2025
- Understanding Price Gaps in Trending February 19, 2025
- Key Takeaways from a Fireside Chat with Perry Kaufman February 12, 2025
- The Power of Patience: How Waiting for the Right Setups Can Make or Break Your Trading Success February 3, 2025
- Mastering Market Trends: The Importance of Analysing Different Timeframes January 23, 2025


Latest Comments