Extreme rectangles: Far more interesting than existing trends
Years ago a very pushy journalist from India’s Hindustan Times badgered me for the opportunity to look around our London dealing room and quiz me about my views on financial markets. Eventually, against my better judgement, I caved in to his requests. His job was covering business and finance, and he was particularly excited by the Indian stock market. I have to admit that then, it wasn’t really on my radar, but always up for the challenge of something new, I quickly created a chart for Mumbai’s Sensex index based on my standard template.
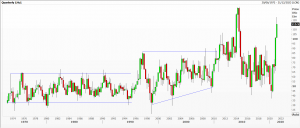
As kindly as I could, I explained that this stock index was stuck in a relatively narrow band (2000 to 6000) and had gone nowhere for the best part of a decade – as it had done the decade before that; two huge rectangles since 1980. I suggested he get in touch with me again when it had broken the latest range.He didn’t get back to me, but when it broke higher I was one of New Delhi TV’s frequent guests because of my outrageously bullish calls based on the height of the rectangle. Then I had to use the width of the rectangle for Fibonacci projections. This chart is a very good example of a paradigm shift, such as we have recently seen in US lumber futures.
 Similar and related patterns can be seen in the price of US lean hog futures. Extended periods of broadly sideways trading, albeit in pretty wide ranges which matter to farmers, and then a surge, followed by a sharp retreat. Will 2021 prove to be another example of the phenomenon?
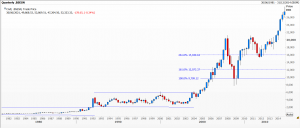
 A variation on a theme is my chart of the Norwegian krone against the US dollar, since developed economy currencies floated in the 1970s. I have plotted the mean regression since then and an upper and lower one standard deviation around this. Think of it as a somewhat flexible rectangle rather than a straightjacket. Here again you can see the tendency to large spike highs (for the US dollar) and far more subdued price action on the downside.
Tags: measured targets, momentum, Rectangles
The views and opinions expressed on the STA’s blog do not necessarily represent those of the Society of Technical Analysts (the “STA”), or of any officer, director or member of the STA. The STA makes no representations as to the accuracy, completeness, or reliability of any information on the blog or found by following any link on blog, and none of the STA, STA Administrative Services or any current or past executive board members are liable for any errors, omissions, or delays in this information or any losses, injuries, or damages arising from its display or use. None of the information on the STA’s blog constitutes investment advice.
Latest Posts
- Navigating the Market: Insights from Robin Griffiths and Ron William April 9, 2025
- Avoid Revenge Trading: The Key to Long-Term Trading Success March 31, 2025
- Mastering Relative Strength Portfolios: Key Takeaways from the March STA Meeting March 12, 2025
- Stay Disciplined, Stay Profitable February 26, 2025
- Understanding Price Gaps in Trending February 19, 2025


Latest Comments