Finding value across asset classes using volume profile
Tuesday the 9th May Rajan Dhall, MSTA and a trader for the last ten years, told us how he uses volume profile. As a moderator for the STA’s education forum his ability to explain new concepts concisely and clearly shone through. In a cleverly tailored talk, with good chart examples and timed to perfection, he covered a range of different markets and instruments, outlining his ideas.
Reminding us of the very basics of price discovery, which is in reality an auction process that has been in use for centuries, the auctioneer starts with a low price that the audience perceives as having value. From here he/she encourages ever higher bids until the last man standing bags the bounty. Clever tactics really, and something we should not forget when the next Initial Public Offering comes around.
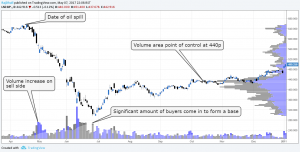
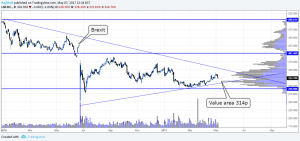
Along the bottom of his (mainly) daily candlestick charts he plots a volume histogram. At the right hand edge we have horizontal histograms with volume at price (see previous blog about this delivered by Paul McLaren). Both of these measure the level of interest between buyers and sellers at all prices.
Termed the ‘volume point of control’ (VPOC) this is the level of maximum trades at a price and is an important chart level to watch. The absolute level will vary between instruments, but one should also compare this to the absolute level of stock outstanding, something we can do with equities. Futures and options outstanding amounts will vary over time but here one should consider daily volume relative to the total open interest.
He then also factors in seasonal trends, like Thomas Cook shares where interest in the company increases after the summer holiday season, how volume fluctuates ahead of significant economic releases, and seasonality more generally.
He reminds us that for some markets volume is either unavailable or suspect. Foreign exchange for example, where members of the audience pointed out that some charting packages produced their own volume data but that futures contract volume was less than 15 per cent of that traded over-the-counter in foreign exchange.
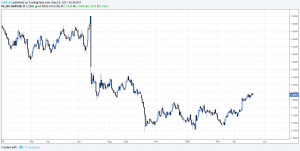
I leave you with two of what I thought were his best charts; the price of BP shares and that of Dixons. The reason I’ve chosen the latter is because of its remarkable similarity to that of sterling against the US dollar. Rajan had explained that the need to import mobile telephones would be impacted by a weaker pound. I had not expected nigh on identical charts!
The software is supplied by TradingView and, though the choice of colours on the volume bars is a bit quirky, Raj assured us that it in no way does it affect how one uses the technique.
Tags: control, pressure, Volume profile
The views and opinions expressed on the STA’s blog do not necessarily represent those of the Society of Technical Analysts (the “STA”), or of any officer, director or member of the STA. The STA makes no representations as to the accuracy, completeness, or reliability of any information on the blog or found by following any link on blog, and none of the STA, STA Administrative Services or any current or past executive board members are liable for any errors, omissions, or delays in this information or any losses, injuries, or damages arising from its display or use. None of the information on the STA’s blog constitutes investment advice.
Latest Posts
- Navigating the Market: Insights from Robin Griffiths and Ron William April 9, 2025
- Avoid Revenge Trading: The Key to Long-Term Trading Success March 31, 2025
- Mastering Relative Strength Portfolios: Key Takeaways from the March STA Meeting March 12, 2025
- Stay Disciplined, Stay Profitable February 26, 2025
- Understanding Price Gaps in Trending February 19, 2025


Latest Comments