Hello darkness my old friend: I’ve come to talk with you again…
‘The song [written by Paul Simon when he was 21 years old] makes an allusion to the extreme capitalism and consumerism that is suffocating society – “the people bowed and prayed to the neon god they made” (neon represents the signs of commercial stores), and further expresses a discontent for humans who do not care to pay attention to anything and anyone.’ From www.wordsinthebucket.com
In fact I wasn’t really thinking about the sounds of silence, but about volatility. How the word is bandied around, how so many fail to grasp its true meaning and how thankfully many of us have been able to avoid its worst extremes. Also because yesterday, Thursday 8th April 2021, the Chicago Board Options Exchange (Cboe) announced that it was extending curb trading on options on the volatility index (VIX) and the S&P 500 (SPX). This means one will be able to trade these nearly 24 hours per day, Monday to Friday. Surprised and ironic Twitter posts from the retail trading fraternity included the suggestion to up the cocaine budget.
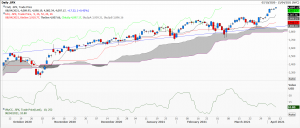
There are several types of volatility: the simplest observed, or historical, which measures the percentage price move from one closing price to the next. My first chart is a daily one of the S&P 500 index, showing a steady uptrend and a rising Ichimoku cloud, below which is historical volatility, running at 10.80%, is plotted.
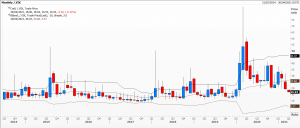
My second chart is a monthly one of the VIX with a Bollinger band, where implied volatility today is running at 16.93% and, while much lower than the peak reached in March 2020, it’s still running a lot higher than what we have observed recently.
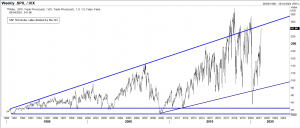
Some people like measuring the ratio between the VIX and the S&P index itself, my third chart (S&P/VIX). While at some of the higher levels of the last 3 decades (with record high price and relatively low volatility), it’s not yet screaming headlines.
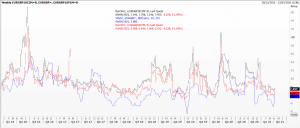
The foreign exchange market is well versed in pricing all sorts of different types of option strategies on countless currency pairs. I’ve picked out an interesting chart on the implied volatilities used on puts and calls on euro/sterling (EURGBP). One-month, ten delta, at the money options on the euro against the pound, weekly bars with historical volatility the blue line. As you can see, since the Brexit referendum in 2016, calls on the euro have been constantly, and significantly more expensive, than puts. Now that’s what I call serious skew!
Tags: implied volatility, put/call skew, ratio, volatility
The views and opinions expressed on the STA’s blog do not necessarily represent those of the Society of Technical Analysts (the “STA”), or of any officer, director or member of the STA. The STA makes no representations as to the accuracy, completeness, or reliability of any information on the blog or found by following any link on blog, and none of the STA, STA Administrative Services or any current or past executive board members are liable for any errors, omissions, or delays in this information or any losses, injuries, or damages arising from its display or use. None of the information on the STA’s blog constitutes investment advice.
Latest Posts
- Navigating the Market: Insights from Robin Griffiths and Ron William April 9, 2025
- Avoid Revenge Trading: The Key to Long-Term Trading Success March 31, 2025
- Mastering Relative Strength Portfolios: Key Takeaways from the March STA Meeting March 12, 2025
- Stay Disciplined, Stay Profitable February 26, 2025
- Understanding Price Gaps in Trending February 19, 2025


Latest Comments