How deep is your knowledge of charts? Why a wide range of reading material helps
I’ve always enjoyed reading and, more importantly, widely. Never confining myself to one genre of literature, or tunnelling into my specialist subject, I’ve roamed far and wide, especially when it comes to current media. Daily and evening newspapers, free weekly magazines, a variety of weekend print publications, monthly magazines (not necessarily at the dentist or hairdresser!), radio, some TV, and now social media.
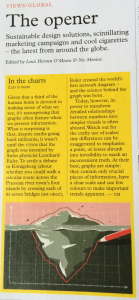
Why am I telling you this? Imagine my surprise when, on the opening page of Monocle magazine issue 139 (Dec/Jan 2020/2021), the lead article’s title was ‘In the charts’, subtitled ‘Less is more’. Being a trendy, Millennial-type design publication, I thought it might be about de-cluttering. In case the font in the photo is too small to read, I have transcribed the text here.
‘Given that a third of the brain is devoted to making sense of what we see, it’s unsurprising that graphs often feature when we present information. What is surprising is that, despite maths going back millennia, it wasn’t until the 1700s that the graph was invented by Swiss physicist Leonhard Euler. To settle a debate in Königsberg [now Kaliningrad, Russia] (about whether you could walk a circular route across the Prussian town’s four islands by crossing each of its seven bridges just once), Euler created the world’s first network diagram – and the science behind the graph were born.’
The text continues, ‘Today, however, its power to transform detailed relationships between numbers into simpler visuals is often abused. Watch out for the crafty use of scales: tiny differences can be exaggerated to emphasise a point, or losses shrunk into invisibility to mask an inconvenient truth. At their best, graphs are simple: they contain only crucial pieces of information, have a clear scale and use few colours to make important trends apparent.’
Sounds familiar to the layman and hits at the heart of technical analysis.
A quick search via the internet and it turns out that Euler’s considered one of the greatest mathematicians in history; (he was also an astronomer, geographer, logician and engineer). Born in Basel, Switzerland, in 1707 he graduated from its University in 1723 a Master in philosophy. He then tucks another degree in maths under his belt in 1726, moves to the St Petersburg Academy of Sciences in 1727, followed by Berlin in 1741. He retuned to St Petersburg in 1766 where he died in 1783.
He was an extremely busy man, publishing 886 academic papers and books despite being blind for the last 20 years of his life, plus marrying twice and having 13 children (many of whom died young). There are suggestions that his ability was underpinned by an exceptional talent for mental calculation and a photographic memory – both of which are handy for technical analysts.
Just for fun, I attach a link to the original puzzle.
Tags: graphs, Mathematics, puzzle
The views and opinions expressed on the STA’s blog do not necessarily represent those of the Society of Technical Analysts (the “STA”), or of any officer, director or member of the STA. The STA makes no representations as to the accuracy, completeness, or reliability of any information on the blog or found by following any link on blog, and none of the STA, STA Administrative Services or any current or past executive board members are liable for any errors, omissions, or delays in this information or any losses, injuries, or damages arising from its display or use. None of the information on the STA’s blog constitutes investment advice.
Latest Posts
- Navigating the Market: Insights from Robin Griffiths and Ron William April 9, 2025
- Avoid Revenge Trading: The Key to Long-Term Trading Success March 31, 2025
- Mastering Relative Strength Portfolios: Key Takeaways from the March STA Meeting March 12, 2025
- Stay Disciplined, Stay Profitable February 26, 2025
- Understanding Price Gaps in Trending February 19, 2025


Latest Comments