Looking forwards and backwards: At this time of year
The child in me still looks forward to opening the little windows on her Advent calendar. Not the rather crass ones filled with chocolates and what not, but the traditional type where the fun is just seeing the picture behind. The start of a new calendar month is also a good time to cast an eagle eye over monthly charts, looking to see whether anything significant has happened, whether patterns in the making are still valid and, better still, if they have been completed.
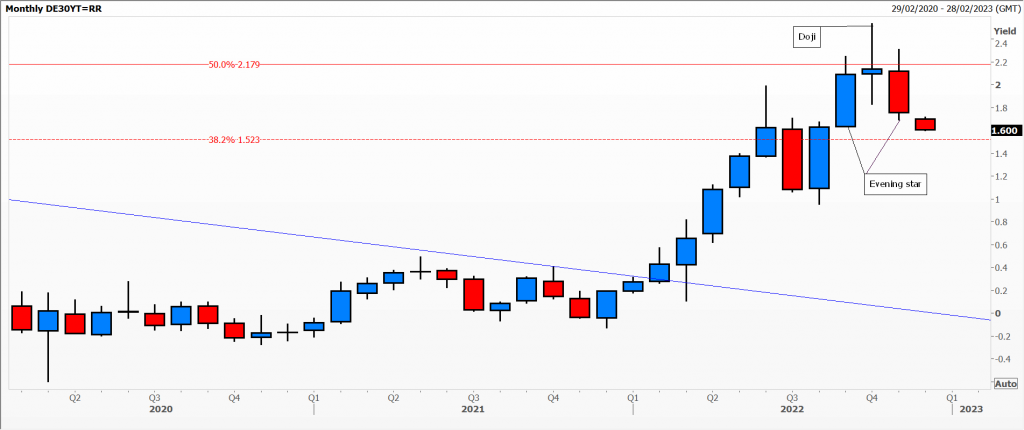
Several of my important markets have seen the completion of a three-candle pattern called an evening star. This must occur after a decent rally, something many have been blindsided by since this summer. My first chart is that of the yield on a 30-year German government bond, known as a Buxl, which was first issued in the early 1990s. For the first time ever this now yields less than its 10-year equivalent, the Bund. This year’s rally in 30-year yields has retraced over half of their decline since 2008. It culminated with a large doji in October. November’s drop mirrors September’s burst higher, the three making up an evening doji star – according to my trusty Steve Nison book. He claims that the central body should not overlap either of the two bodies next to it – which is not quite the case here – but I’m prepared to be a bit more flexible.
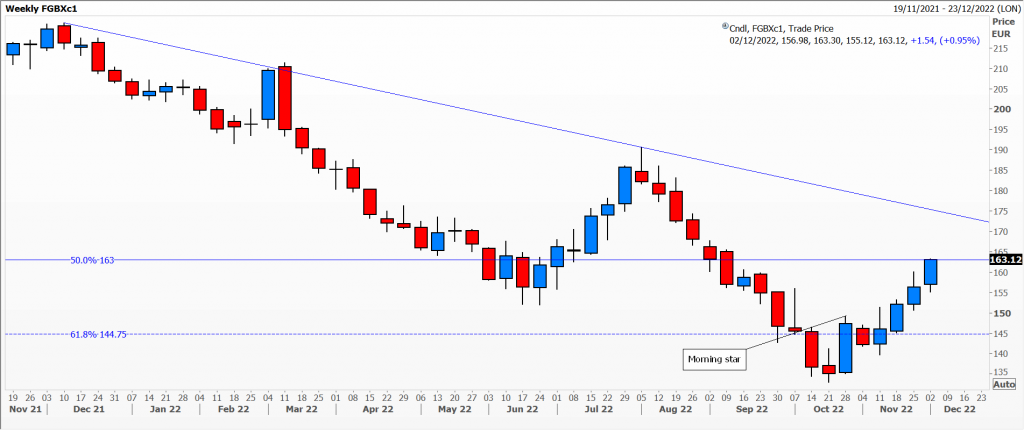
Interestingly if you look at the chart of the front-month Buxl future you will see the inverse of this pattern – known as a morning star and occurring at the bottom of a bear market – in the first three weeks in October. This illustrates the concept of ‘fractals’.
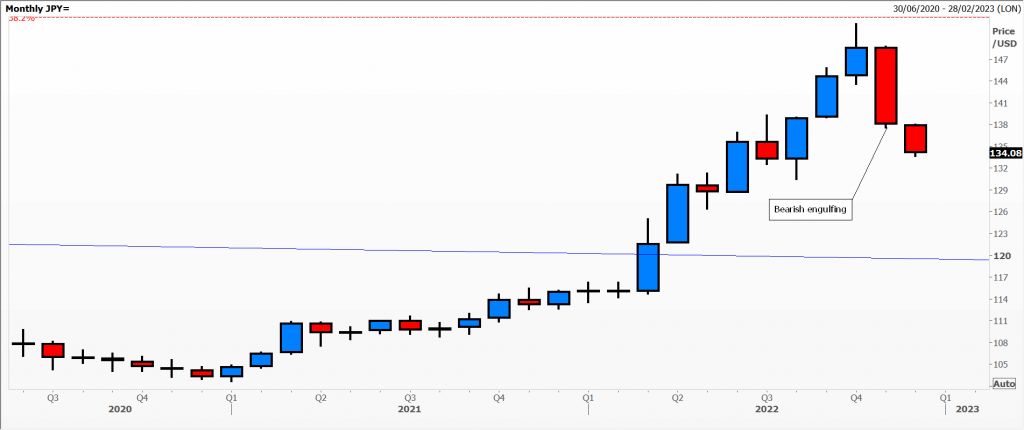
My next chart is a variation on this theme. After a frenzied rally since April the exchange rate between the US dollar and the Japanese yen stalled suddenly in October having retraced a Fibonacci 38% of the dollar’s losses since 1982, reaching the yen’s weakest since 1990. November’s slump in the exchange rate is a bearish engulfing candle which covers the two previous ones, reinforcing the power of October’s high point. Nison references a Japanese book called ‘The Fountain of Gold – The Three Monkey Record of Money’. This text references the yin (bearish) and yang (bullish) of market moves, saying ‘’when movement reaches an extreme there is stillness. This stillness gives rise to yin’’. Other three-candle patterns are self-evident: three white soldiers and three back crows.
Tags: evening stars, monthly charts, three-candle patterns
The views and opinions expressed on the STA’s blog do not necessarily represent those of the Society of Technical Analysts (the “STA”), or of any officer, director or member of the STA. The STA makes no representations as to the accuracy, completeness, or reliability of any information on the blog or found by following any link on blog, and none of the STA, STA Administrative Services or any current or past executive board members are liable for any errors, omissions, or delays in this information or any losses, injuries, or damages arising from its display or use. None of the information on the STA’s blog constitutes investment advice.
Latest Posts
- Navigating the Market: Insights from Robin Griffiths and Ron William April 9, 2025
- Avoid Revenge Trading: The Key to Long-Term Trading Success March 31, 2025
- Mastering Relative Strength Portfolios: Key Takeaways from the March STA Meeting March 12, 2025
- Stay Disciplined, Stay Profitable February 26, 2025
- Understanding Price Gaps in Trending February 19, 2025


Latest Comments