Low, low volatility: Vix versus the rest
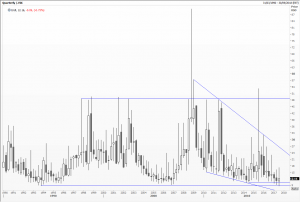
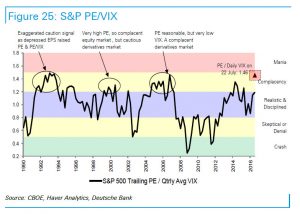
The Vix index, originally developed by Menachem Brenner and Dan Galai in 1986, was launched as a futures contract in 2004 on the Chicago Board Options Exchange (then options on this future introduced in 2006). It followed the stock market crash of 1987 and slump in 1990, and measures the implied volatility of a series of options on the expected annualised change in the S&P 500 futures with a one month time horizon. Known as the ‘fear gauge’ it is breathlessly watched by headline chasers.
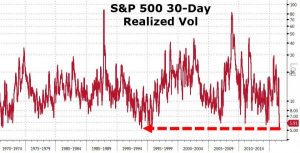
You will perhaps by now be spluttering that historical charts go back much further, because we have recently matched the record low of 1993 (8.89%); that’s because Robert Whaley computed the series retrospectively to 1986. More importantly, it is a very narrow measure of stress in global stock markets.
I was dramatically reminded of this on Tuesday when subdued US and European indices meant nothing to investors in one particular stock: Provident Financial, a 137-year old UK Bradford-based sub-prime lender. An unscheduled trading update, complete with another profit warning, scrapping of dividend, and ‘resignation’ of the CEO, saw the shares close down a whopping 66 per cent down on the day at 589.5 pence (and an intra-day loss of 72 per cent). Remember, this is no AIM listed tiddling, unicorn, or tech company. This stock has been in the FTSE 100 since December 2015.
I’m finding it hard to remember anything this dramatic in my long career. Twenty per cent losses on individual shares occur more frequently than stockbrokers would like to admit, and bond prices of failing companies and nations have done so regularly over the years. Currencies can and often do so, but more usually over a period of months.
Mind you, it’s not all one way. Also on the 22nd of August 2017 shares of Centrais Elétricas Brasileiras, Latin America’s biggest electricity generator, rallied 46 per cent. Hopes of reorganisation and so on, but another game-changer.
What is important here is that current portfolio theory suggests that over-diversification is unhelpful and that index tracking carries inherent dangers. Many suggest that one should concentrate one’s investments in 10 to 20 core holdings, do the homework, and plan ahead. The trouble with this is that a hit of Provident’s magnitude, as has been the case of one of star fund manager Neil Woodford, knocks one off course for months and more. Any portfolio that suffers a 20-plus per cent hit will struggle to regain its original value, let alone beat its peers.
Tags: options, Portfolio, volatility
The views and opinions expressed on the STA’s blog do not necessarily represent those of the Society of Technical Analysts (the “STA”), or of any officer, director or member of the STA. The STA makes no representations as to the accuracy, completeness, or reliability of any information on the blog or found by following any link on blog, and none of the STA, STA Administrative Services or any current or past executive board members are liable for any errors, omissions, or delays in this information or any losses, injuries, or damages arising from its display or use. None of the information on the STA’s blog constitutes investment advice.
Latest Posts
- Navigating the Market: Insights from Robin Griffiths and Ron William April 9, 2025
- Avoid Revenge Trading: The Key to Long-Term Trading Success March 31, 2025
- Mastering Relative Strength Portfolios: Key Takeaways from the March STA Meeting March 12, 2025
- Stay Disciplined, Stay Profitable February 26, 2025
- Understanding Price Gaps in Trending February 19, 2025


Latest Comments