Mastering Market Trends: The Importance of Analysing Different Timeframes
When it comes to trading and technical analysis, one of the most valuable strategies is understanding and utilising multiple timeframes. Whether you’re a day trader, a swing trader, or a long-term investor, looking at trends across daily, hourly, and weekly charts can provide a more comprehensive view of the market and enhance your decision-making process. In this blog, we’ll explore why this approach is crucial and how you can use it to identify key support and resistance levels, trend directions, and optimal entry and exit points.
1. The Weekly Timeframe: The Big Picture
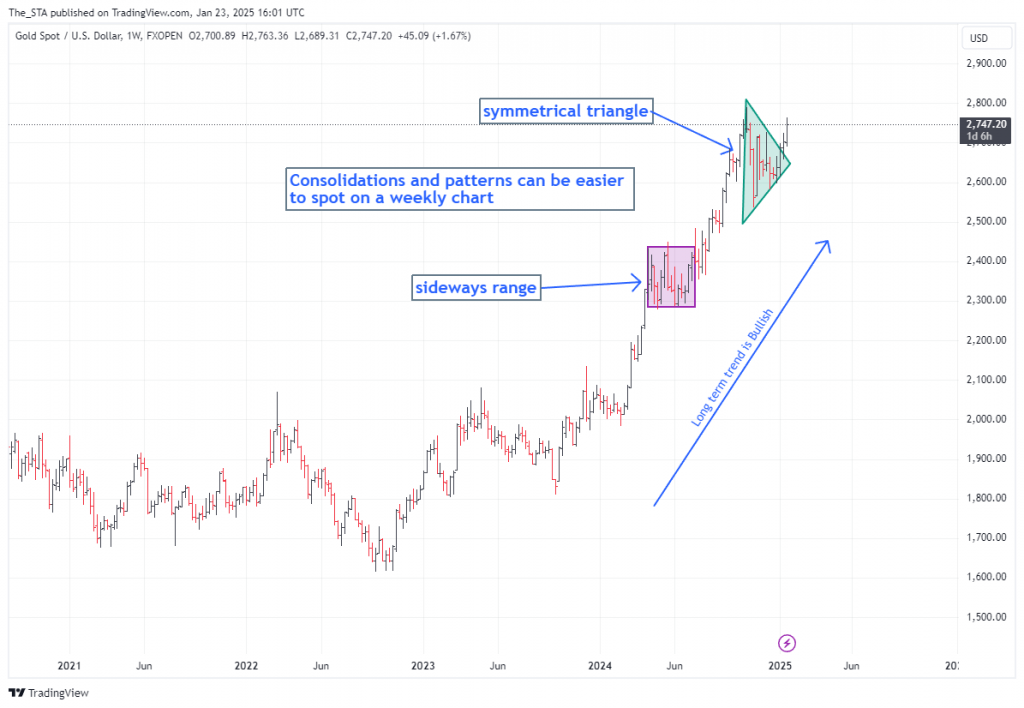
The weekly chart is your go-to tool for capturing the broader market trend. It reveals the long-term direction of an asset’s price, helping traders and investors understand the bigger picture.
Why It Matters:
• Long-term Trend: A weekly chart smooths out daily noise and highlights sustained trends over months or years.
• Key Levels: Major support and resistance levels that show up on the weekly chart are often the most reliable and can act as strong price boundaries.
• Investor Sentiment: It provides a glimpse into how the market views an asset over a prolonged period.
How to Use It:
• Look for overall trend direction (uptrend, downtrend, or sideways).
• Mark major support and resistance levels.
• Identify key patterns such as double tops, head and shoulders, or trendline breaks.
2. The Daily Timeframe: The Tactical View
The daily chart is a favourite for swing traders and those looking to capitalise on medium-term price movements. It strikes a balance between the long-term perspective of the weekly chart and the granular detail of the hourly chart.
Why It Matters:
• Trend Confirmation: The daily chart can confirm whether the weekly trend is still valid or if momentum is shifting.
• Key Events: Price reactions to news, earnings, or economic data often play out clearly on the daily timeframe.
• Actionable Signals: Patterns like flags, pennants, and candlestick formations (e.g., doji, engulfing) are prominent.
How to Use It:
• Identify daily highs and lows to spot potential breakout or breakdown points.
• Align daily trends with the weekly trend for confluence.
• Use indicators like moving averages or RSI to confirm strength or weakness.
3. The Hourly Timeframe: The Precision Lens
For day traders and those who thrive on short-term volatility, the hourly chart (and sometimes even shorter time frames) offers unparalleled precision. This timeframe is ideal for capturing intraday moves and refining entries and exits.
Why It Matters:
• Fine-Tuned Analysis: The hourly chart helps you time trades more precisely within the context of the daily and weekly trends.
• Intraday Levels: Short-term support and resistance levels emerge clearly.
• Immediate Reactions: It captures market responses to news or events as they unfold.
How to Use It:
• Monitor intraday patterns such as wedges, triangles, and volume spikes.
• Use it in conjunction with higher timeframes to validate setups.
• Pinpoint ideal entry and exit points with tools like Fibonacci retracements or Bollinger Bands.
4. Why Combine Timeframes?
Analysing multiple timeframes is like piecing together a puzzle. Each timeframe offers unique insights, but the magic happens when they work in harmony. Here are some key reasons to integrate this approach:
• Trend Confluence: A strong uptrend on the weekly chart that aligns with bullish signals on the daily and hourly charts increases the probability of a successful trade.
• Risk Management: Identifying conflicting signals between timeframes can help you avoid risky trades.
• Comprehensive View: A single timeframe may miss nuances, but combining perspectives ensures you don’t overlook critical details.
Practical Application: A Step-by-Step Example
1. Start with the Weekly Chart: Identify the overarching trend and mark major support and resistance levels.
2. Move to the Daily Chart: Look for alignment with the weekly trend. Check for actionable patterns or signals within the weekly framework.
3. Zoom in on the Hourly Chart: Refine your entry and exit points. Use intraday volatility to your advantage while staying within the broader trend.
Pro Tips for Using Multiple Timeframes
• Top-Down Approach: Always start with the higher timeframe (weekly) and work your way down. This ensures you’re trading in the direction of the dominant trend.
• Key Level Confluence: Pay attention when support or resistance levels align across timeframes. These levels are often the most significant.
• Avoid Overloading: Stick to three timeframes to keep your analysis manageable and focused.
Conclusion
Analysing multiple timeframes is a powerful technique for gaining a holistic view of the market. Whether you’re identifying long-term opportunities or fine-tuning a short-term trade, integrating weekly, daily, and hourly charts can significantly enhance your strategy. Remember, trading is not about predicting the market—it’s about increasing your odds. Using this multi-timeframe approach is a step toward smarter, more informed trading decisions.
Ready to take your analysis to the next level? Start incorporating different timeframes into your routine and watch your trading insights soar!
Tags: markets, technical analysis, trading, Tradingtips
The views and opinions expressed on the STA’s blog do not necessarily represent those of the Society of Technical Analysts (the “STA”), or of any officer, director or member of the STA. The STA makes no representations as to the accuracy, completeness, or reliability of any information on the blog or found by following any link on blog, and none of the STA, STA Administrative Services or any current or past executive board members are liable for any errors, omissions, or delays in this information or any losses, injuries, or damages arising from its display or use. None of the information on the STA’s blog constitutes investment advice.
Latest Posts
- Navigating the Market: Insights from Robin Griffiths and Ron William April 9, 2025
- Avoid Revenge Trading: The Key to Long-Term Trading Success March 31, 2025
- Mastering Relative Strength Portfolios: Key Takeaways from the March STA Meeting March 12, 2025
- Stay Disciplined, Stay Profitable February 26, 2025
- Understanding Price Gaps in Trending February 19, 2025


Latest Comments