Mind the Gap! As they say on the London Underground
Their trains come in two sizes: bigger, 8 carriage ones on the sub-surface lines and smaller 6 carriage ones for the deep tube lines (the local vernacular). This allows trains to flex but, in doing so, the centre of each carriage is further away from the platform at curved stations.
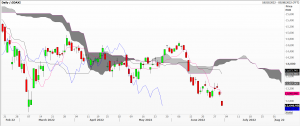
Technical analysts are well-versed in the importance of gaps and their associated chart patterns. Gaps occur when there is no trading at a particular price or cluster of price levels. This usually happens when something startling happens making investors re-evaluate assumptions and how much they are willing to pay for something – or how desperately they need to sell an asset. The thinner the market, the more likely gaps will occur.
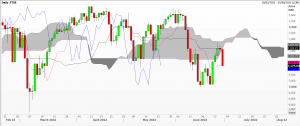
But some markets never gap because of the way they are calculated. The US Dow indices and the UK’s FTSE 100 index always open at exactly the level they left off at the close of business the previous session. As individual shares start trading the next session, the index is re-calculated and index values are released and can be plotted.
Very liquid markets that trade continuously 24 hours a day, five days a week rarely gap. This applies mainly to the over-the-counter FX market, some futures contracts actively traded electronically, and bullion to a lesser extent. Some of these trade longer than 120 hours per week, starting at 20:00 GMT Sunday in Asia and end the week at 20:00 GMT Friday as Chicago markets close.
Most gaps occur between closing levels and the following period’s open. These can easily be seen with candlestick charts and more often than not get filled with the wicks or bodies of the subsequent candles at some point in the trading session. If they are not closed promptly, then theory suggests they will do so shortly.
But the gaps that really matter are the ones that are never filled. Think of it as a big emotional loss. It makes a strong impression, is hard to deal with, and may come back to haunt you. These are usually associated with island reversals, exhaustions and impulsive new breaks higher. Get a grip and get to know your gaps.
The two charts, FTSE 100 and DAX 30 daily, are courtesy of MetaStock Xenith by Refinitiv
There is plenty more commentary and analysis available if you join the STA. Become a member and get 10% off your first year’s subscription by quoting this code number STABLOG
Tags: candles, gaps, patterns
The views and opinions expressed on the STA’s blog do not necessarily represent those of the Society of Technical Analysts (the “STA”), or of any officer, director or member of the STA. The STA makes no representations as to the accuracy, completeness, or reliability of any information on the blog or found by following any link on blog, and none of the STA, STA Administrative Services or any current or past executive board members are liable for any errors, omissions, or delays in this information or any losses, injuries, or damages arising from its display or use. None of the information on the STA’s blog constitutes investment advice.
Latest Posts
- Navigating the Market: Insights from Robin Griffiths and Ron William April 9, 2025
- Avoid Revenge Trading: The Key to Long-Term Trading Success March 31, 2025
- Mastering Relative Strength Portfolios: Key Takeaways from the March STA Meeting March 12, 2025
- Stay Disciplined, Stay Profitable February 26, 2025
- Understanding Price Gaps in Trending February 19, 2025


Latest Comments