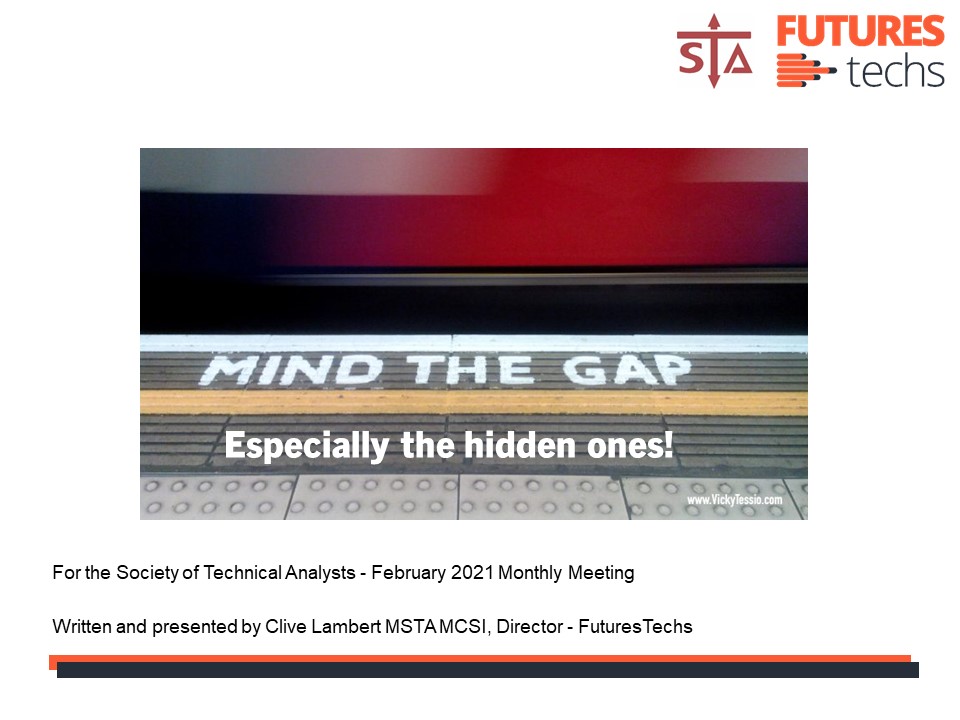
Mind the Gap! ‘Support, Resistance – Hidden Gaps and other Methods’
February’s STA Monthly Meeting was yesterday, Tuesday the 9th, via Zoom webinar. The guest speaker was Clive Lambert, vice-Chair of our society, also on its education and marketing committees, and an IFTA board member. We have all heard about gaps but what is a hidden gap?
He starts at the very beginning, with gap basics – or ‘windows’ as he tells us they’re called in Japanese. A gap in price action is measured from low to high – or vice versa – not from close to open; i.e. not using the real body of the candle.
He explains the famous breakaway, measuring and exhaustion gaps, noting that he doesn’t like the middle one and the last one is ‘’silly season’’. Within half an hour he’s covered ‘’the textbook stuff’’, as he calls it, and information that all technicians should have in their toolbox.

We then move on to hidden gaps part I. Basically, with his CQG charting package he can opt which part of the day to chart – roughly mimicking what used to be the official trading sessions. This is a simple but effective way to break down a lot of data, by doing this you can focus on the busy periods of the day, leaving out overnight, and sometimes almost irrelevant, price action. To select which bits to focus on he uses volume as a guide. After all it only makes logical sense to see if people are buying or selling at the most active part of the trading day……
Here he offers some nice chart combinations, like the S&P 500 E-mini contract day session only, the DAX front month continuation, and the FTSE 100 all sessions futures chart versus one with night-time trading stripped out. This way you can see more clearly buying or selling patterns in their own time zones.
Part II of hidden gaps includes potentially stripping out the Asian session in foreign exchange, a very brief introduction to Market Profile (where vacuums are created with single prints in a half-hour session – and are therefore a type of gap), and ‘volume at points of control’, Thus offering us a fascinating taster of how to use Market Profile. Anybody wanting to learn more about this subject can do so on Clive’s blog www.futurestechs.co.uk/blog.
Tags: All Session, candles, gaps, Market Profile, Vacuum
The views and opinions expressed on the STA’s blog do not necessarily represent those of the Society of Technical Analysts (the “STA”), or of any officer, director or member of the STA. The STA makes no representations as to the accuracy, completeness, or reliability of any information on the blog or found by following any link on blog, and none of the STA, STA Administrative Services or any current or past executive board members are liable for any errors, omissions, or delays in this information or any losses, injuries, or damages arising from its display or use. None of the information on the STA’s blog constitutes investment advice.
Latest Posts
- Navigating the Market: Insights from Robin Griffiths and Ron William April 9, 2025
- Avoid Revenge Trading: The Key to Long-Term Trading Success March 31, 2025
- Mastering Relative Strength Portfolios: Key Takeaways from the March STA Meeting March 12, 2025
- Stay Disciplined, Stay Profitable February 26, 2025
- Understanding Price Gaps in Trending February 19, 2025


Latest Comments