More secondary technical indicators: But do you care?
Last week we looked at the NYSE Arms Index for the S&P 500, a technical tool I hadn’t used in years and couldn’t remember what it was. It set me thinking: there must be lots of people like myself who only stick to their tried and tested tools. One step on, and I thought: there must be loads of novice chart bugs who have never been introduced to some of the more esoteric technical analysis methods, especially in the plethora of secondary indicators.
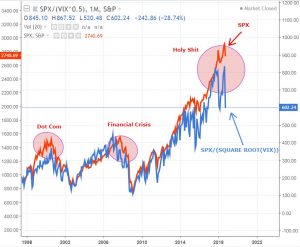
As luck would have it, October’s sharp moves in many stock indices have brought these out like a rash, and every commentator worth his salt claims to have spotted something really special. This might be a method that’s rarely used, like the ratio between an index’s level and its level of implied volatility. This sort of thing strikes a cord with fundamental analysts who use price/earnings ratios, or index levels compared to GDP.
Key this month is the VIX, the Chicago Board Options Exchange’s much-loved (and vilified) measure of annualised implied volatility as expressed in S&P 500 options over the next 30 days. Divide the S&P 500 level by this, and a measure of extreme euphoria or doom follows. One step further on, and I found out today that Twitter fan @hks55 divides the value of the S&P 500 index by a ‘square root transformed’ version of VIX.
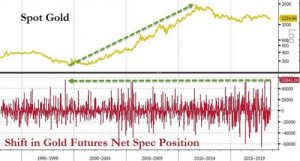
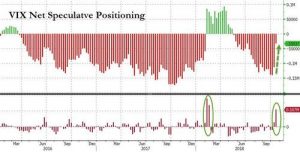
Ploughing ahead and many currently like looking at the Net Commitment of Traders, Net Speculative Positioning and Net Non-Commercial data. Personally, I’m not sold on these, but I’ll tell you about them anyway. It’s the net between long and short open futures positions of certain categories of investor. Think: professionals versus retail. Again, stockbrokers like tracking the selling activity of directors in their firms.
VIX open interest of trader-types was increasingly dominated by short positions since the beginning of summer. The same was true for short positions on gold futures and US 10-year Treasury Note futures, both of which reached negative readings not seen for many years. In other words, people weren’t worried about risk and all too many bets were pointing in the same direction.
You guessed it: over the last couple of weeks bullish horns have been drawn in dramatically, though only gold futures have seen relatively serious capitulation. Perhaps rather like the Relative Strength Index, one that I only use when really seriously extreme levels are reached.
Tags: Net Speculative Positioning, Ratios, Secondary Indicators, VIS
The views and opinions expressed on the STA’s blog do not necessarily represent those of the Society of Technical Analysts (the “STA”), or of any officer, director or member of the STA. The STA makes no representations as to the accuracy, completeness, or reliability of any information on the blog or found by following any link on blog, and none of the STA, STA Administrative Services or any current or past executive board members are liable for any errors, omissions, or delays in this information or any losses, injuries, or damages arising from its display or use. None of the information on the STA’s blog constitutes investment advice.
Latest Posts
- Navigating the Market: Insights from Robin Griffiths and Ron William April 9, 2025
- Avoid Revenge Trading: The Key to Long-Term Trading Success March 31, 2025
- Mastering Relative Strength Portfolios: Key Takeaways from the March STA Meeting March 12, 2025
- Stay Disciplined, Stay Profitable February 26, 2025
- Understanding Price Gaps in Trending February 19, 2025


Latest Comments