Nice legs: Shame about the face
Or to paraphrase: the Hindenburg Omen has a good name; shame about its reliability. Developed to monitor shares on the New York Stock Exchange, it could be used for any other major international index but, surprisingly, is not. While the ideas behind it are sound, its track record isn’t exactly stellar.
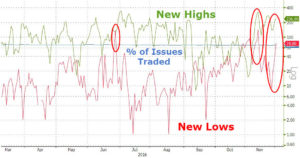
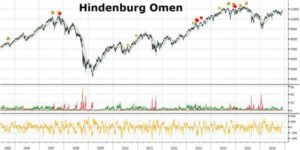
Named after the German Zeppelin airship which burst into flames and crashed in 1937, it’s supposed to warn of an impending stock market collapse. It monitors the number of shares in New York notching up new 52-week highs versus those hitting 52-week lows; a sort of measure of internal market strength. According to Wikipedia the rules are as follows:
- The daily number of NYSE new 52 week highs and the daily number of new 52 week lows are both greater than or equal to 2.8 per cent (this is typically about 84 stocks) of the sum of NYSE issues that advance or decline that day (typically, around 3000).[2] An older version of the indicator used a threshold of 2.5 per cent of total issues traded (approximately 80 of 3200 in today’s market).
- The NYSE index is greater in value than it was 50 trading days ago – 50-day Rate of Change (ROC) should be positive. Originally, this was expressed as a rising 10 week moving average, but the new rule is more relevant to the daily data used to look at new highs and lows.
- The McClellan Oscillator is negative on the same day.
- The number of New 52 week highs cannot be more than twice the number of new 52 week lows (though new 52 week lows may be more than double new highs).
A similar idea to Dow Theory, in that the indices must back each other up. If some stocks are raging bulls, and others howling bears, this cannot be healthy. To keep a sense of perspective an exponential moving average is used as a benchmark.
On the 3rd December 2016 Zero Hedge (a web site I can recommend for alternative and sometimes alarmist articles) wrote that technical analyst Tom McClellan had found one of these sinister patterns in the S&P 500 index. The link to the piece is attached below.
http://www.zerohedge.com/news/2016-12-03/did-market-just-flash-hindenburg-omen-warning
While his warning now appears premature, one must admit that the grudging rally over the last two months or so, and the tiny daily ranges seen (causing the VIX index to collapse) are really rather unusual, especially at record highs for the index.
In summary: just because it’s technical analysis, doesn’t mean it ought to be followed unquestioningly.
Tags: crash, market internals, NYSE
The views and opinions expressed on the STA’s blog do not necessarily represent those of the Society of Technical Analysts (the “STA”), or of any officer, director or member of the STA. The STA makes no representations as to the accuracy, completeness, or reliability of any information on the blog or found by following any link on blog, and none of the STA, STA Administrative Services or any current or past executive board members are liable for any errors, omissions, or delays in this information or any losses, injuries, or damages arising from its display or use. None of the information on the STA’s blog constitutes investment advice.
Latest Posts
- Navigating the Market: Insights from Robin Griffiths and Ron William April 9, 2025
- Avoid Revenge Trading: The Key to Long-Term Trading Success March 31, 2025
- Mastering Relative Strength Portfolios: Key Takeaways from the March STA Meeting March 12, 2025
- Stay Disciplined, Stay Profitable February 26, 2025
- Understanding Price Gaps in Trending February 19, 2025


Latest Comments