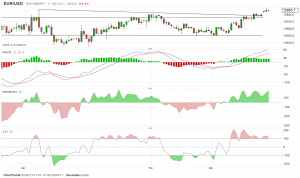
Oscillators: Pick and mix
Last week a reader wrote in asking why I tended to use a clutch of oscillators in what he saw as a rather random manner; that set me thinking. Which ones do I favour and why? Why do I flip between them in my analysis? Should I use them more consistently, and even more regularly?
My answer to all of these questions would, first and foremost, be: to each his own. There is no ‘correct’ way of carrying out your technical analysis. Purists will disagree but often those bending the rules – because they understand them very well – come up with fascinating and practical innovations. As with any type of study, the ability to explain one’s rationale clearly and produce forecasts which can be acted upon is essential.
But I might go one further: why use oscillators at all? My primary focus is very much on price action itself. The shape of candles, the patterns these group into, trends versus consolidation periods. My secondary tools are all sorts of other conventional technical analysis indicators which are one step removed from the raw data. So, moving averages, mean regression, standard deviations and all the other ones generated by a mathematical formula.
Which indicator I focus on will depend on the narrative suggested by price action. So if I’m looking for a basing pattern, I’ll check to see if the RSI is in oversold territory. If that doesn’t support my premise I’ll search for something else, of which the commodity channel indicator tends to be one that generates signals more quickly than others. This started to turn bullish for the euro/dollar exchange rate in mid-February, followed by the MACD very early in March, with momentum clearly bullish a few days after that.
My approach may lack rigour, but it’s very useful when writing reports and explaining one’s thinking. Funnily enough lots of people love technical indicators perhaps precisely because they have the veneer of mathematical rigour about them.
Tags: commodity channel index, MACD, momentum, oscillators, RSI
The views and opinions expressed on the STA’s blog do not necessarily represent those of the Society of Technical Analysts (the “STA”), or of any officer, director or member of the STA. The STA makes no representations as to the accuracy, completeness, or reliability of any information on the blog or found by following any link on blog, and none of the STA, STA Administrative Services or any current or past executive board members are liable for any errors, omissions, or delays in this information or any losses, injuries, or damages arising from its display or use. None of the information on the STA’s blog constitutes investment advice.
Latest Posts
- Navigating the Market: Insights from Robin Griffiths and Ron William April 9, 2025
- Avoid Revenge Trading: The Key to Long-Term Trading Success March 31, 2025
- Mastering Relative Strength Portfolios: Key Takeaways from the March STA Meeting March 12, 2025
- Stay Disciplined, Stay Profitable February 26, 2025
- Understanding Price Gaps in Trending February 19, 2025


Latest Comments