Point and Figure is Pro-Level Tic, Tac, Toe: Noughts and Crosses to us Brits
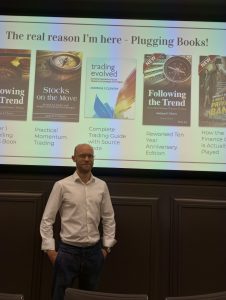
Andreas Clenow flew in from Zurich to give an in-person presentation at June’s regular STA monthly meeting. Billed in a lengthy promotional email as: ‘This presentation will demonstrate that there are flaws in point and figure which can be fixed. By quantifying P&F and constructing trading rules based on it, it becomes very clear which parts of the approach make perfect sense and which parts need to be modernised. By making one single, and perhaps controversial change to the point and figure framework, we can construct trading models and apply modern quantitative methodology.’
Right, I thought, I know exactly which segment of our membership this will appeal to.
Rather than diving straight into his big idea, he spent the first 25 minutes on the very, very basics of plotting a traditional point and figure chart – probably boring the old hands. However, he clearly explained the  limitations of linear, Average True Range and percentage scaling while repeatedly insisting that this charting method is mainly used for individual stocks.
The next, of his very clear black and white slides is titled: ‘Let’s Science the S**t out of This’ – which is the fun bit according to him. “I like to do portfolio testing on a large scale’’ for which he has created a custom built Python program covering 1000s of stocks on a daily close basis since 1990 (no intra-day trading). His rules here are mercifully simple, with no leverage and no short positions, and trade entry and exit points are on a next-day opening price. A chart or two of his performance relative to the S&P 500 (with reinvested dividends) is impressive, with better Sharpe ratios and smaller maximum drawdowns too.
His charts take volatility into account because it changes over time, changes which can be dramatic. For this he uses Standard Deviation, dispenses with grid lines, and literally his Xs and Os get bigger and smaller over time. This will of course affect patterns which are not at exactly the same horizontal levels.
After exactly 50 minutes he ably took questions, including some from leading lights in the fields of point and figure and building trading systems, a challenge which was appreciated by the audience. An experienced and good speaker, his day-job for many years is as CIO of a Family Office which has not actively used the ideas explored in his presentation.
Tags: finance, markets, STA news, technical analysis, Technical Analysis Courses, trading, trending
The views and opinions expressed on the STA’s blog do not necessarily represent those of the Society of Technical Analysts (the “STA”), or of any officer, director or member of the STA. The STA makes no representations as to the accuracy, completeness, or reliability of any information on the blog or found by following any link on blog, and none of the STA, STA Administrative Services or any current or past executive board members are liable for any errors, omissions, or delays in this information or any losses, injuries, or damages arising from its display or use. None of the information on the STA’s blog constitutes investment advice.
Latest Posts
- Trust Me, I’m a Technical Analyst by Trevor Neil: Why Charting Is as Important Now as Ever October 15, 2025
- Why Networking Still Matters: Reflections from the STA Drinks at the National Liberal Club October 2, 2025
- Fireside Wisdom: Clive Lambert in Conversation with Tony LaPorta September 10, 2025
- Understanding Triple RSI Divergence: A Potential Warning Sign for the S&P 500 September 1, 2025
- Unlock Your Potential in Finance: Join the Society of Technical Analysts – No Qualifications Required July 24, 2025


Latest Comments