Ratios worth worrying about: Rules of thumb
As technical analysts we are used to working with ratios. Perhaps the most famous are the ones devised by Fibonacci, the Italian mathematician called Leonardo Pisano who was born about 1170. Picking up the Hindu-Arabic numeral system by living in what is now Algeria he discovered the Golden Mean, the ratio 1.6180339887… and its inverse 0.618034 – popular market price retracement and projection targets.
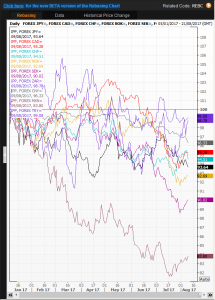
Technical and fundamental analysts also use price moves expressed as percentages. Sometimes called rebasing charts, they are handy to compare a set of similar and related instruments. Starting each member of the set at a value of 100, one can quickly see which currency has done best against the US dollar, for example, so far this year. See the chart below.
Early on kids are introduced to fractions and have no trouble understanding that half a pie is a lot more than a quarter. Bankers too use ratios, most obviously when comparing a potential borrower’s income to the loan they are looking for. Also key for their business are the ratios between capital and assets – which are the loans that have been granted. They keep an eye on the proportion of debts that are in arrears, doubtful, or gone sour to the total outstanding.
Before Big Bang a rule of thumb was to lend every pound on deposit ten times over; a ratio of 10:1. Prudent old-fashioned banking tried to keep bad debts capped at about 5 per cent, annual provisioning for these established accounting practice. Then bankers discovered the cocaine of leverage, how this could inflate return on assets, profitability, and allow them to earn bigger bonuses. So the merry-go-round whizzed ever faster, the band played on, and some financial institutions were using ratios of up to 40:1.
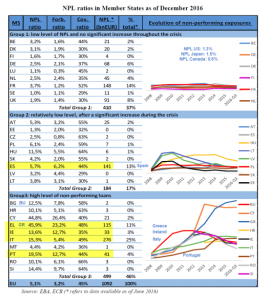
Then, as infamously mouthed by Chuck Prince, CEO of Citigroup, ‘as long as the music is playing you’ve got to get up and dance’. The global financial system had started creaking a decade ago and we know what happened next. Yet the problem lumbers on. Data from the European Central Bank and European Banking Authority list the ratio of non-performing loans in the European Union. Their table is attached below.
As you can see in terms of billions of euros (276) and ratio to total (25 per cent) Italy has by far the biggest problem. France and Spain have just over 140 billion apiece, but the difference is that Spain’s total is over 5 per cent of all loans (as is Austria’s). For nations of just over 10 million people, Greece and Portugal certainly learned how to pile on debt – and watch their banks topple under way too many bad loans. Cyprus remains a very troubled Eurozone member.
Tags: Banks, Capital, debt, European Union, ratio
The views and opinions expressed on the STA’s blog do not necessarily represent those of the Society of Technical Analysts (the “STA”), or of any officer, director or member of the STA. The STA makes no representations as to the accuracy, completeness, or reliability of any information on the blog or found by following any link on blog, and none of the STA, STA Administrative Services or any current or past executive board members are liable for any errors, omissions, or delays in this information or any losses, injuries, or damages arising from its display or use. None of the information on the STA’s blog constitutes investment advice.
Latest Posts
- Navigating the Market: Insights from Robin Griffiths and Ron William April 9, 2025
- Avoid Revenge Trading: The Key to Long-Term Trading Success March 31, 2025
- Mastering Relative Strength Portfolios: Key Takeaways from the March STA Meeting March 12, 2025
- Stay Disciplined, Stay Profitable February 26, 2025
- Understanding Price Gaps in Trending February 19, 2025


Latest Comments