Seasons Greetings: To seasonality
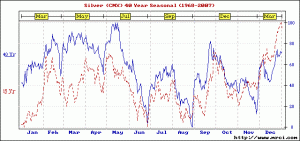
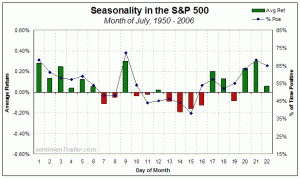
DEFINITION: A characteristic of a time series in which the data experiences regular and predictable changes which recur every calendar year. Any predictable change or pattern in a time series that recurs or repeats over a one-year period can be said to be seasonal.
John Murphy says: ‘One seasonal pattern that seems to apply to all markets is that a penetration of the January high is considered bullish. It can be determined what the percentage probabilities are for a seasonal move during each month and week of the year, depending on how many times such moves took place in the past during the same time period. A reading of 80% is considered a strong seasonal pattern. Anything under 65% is considered suspect.’
Farmers are all too aware of the changing seasons and how they will affect their work patterns, crop yields, and prices. Not surprisingly traders of agricultural futures contracts all over the world keep a keen eye on meteorological forecasts, including the bigger picture like this year’s strong El Niño effect.
Retailers constantly display and sell stock appropriate to the time of year, December being a particularly important month in the Western world. Sometimes they get well ahead of themselves, pushing swimwear in February and snow tyres in August – rather like the financial speculator who leaps in well before a market turn develops.
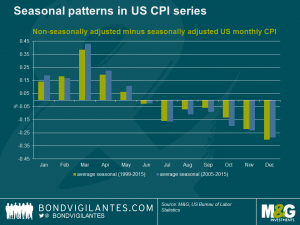
When collecting data on the economy we make allowances for known and expected seasonality, the adjustments themselves subject to constant scrutiny and revision. But what many tend to forget is that retail price inflation itself is subject to known patterns over the year. Statisticians publish seasonally adjusted series, sometimes called SAAR (seasonally adjusted annual rate), and in a most interesting article by Jean-Paul Jaegers for M&G Bond Vigilantes he explains the importance of this in the pricing of index-linked bonds. Please go to the link below for his full article.
The strong salient feature is the fact that consumer price inflation rises quite strongly in the US between January and May, but then starts dropping through to year end. Breakeven inflation expectations not surprisingly mirror this strongly in the first four months of the year, declining (though not as steadily) from then on. One must also remember that inflation suffers from base effects which drop out over one calendar year.
With inflation in some countries negative, Switzerland at the moment minus 1.4 per cent annualised, it would be interesting to see if a mirror image of the seasonal effect – prices dropping sharply early in the year and increasing later on – was observed.
The views and opinions expressed on the STA’s blog do not necessarily represent those of the Society of Technical Analysts (the “STA”), or of any officer, director or member of the STA. The STA makes no representations as to the accuracy, completeness, or reliability of any information on the blog or found by following any link on blog, and none of the STA, STA Administrative Services or any current or past executive board members are liable for any errors, omissions, or delays in this information or any losses, injuries, or damages arising from its display or use. None of the information on the STA’s blog constitutes investment advice.
Latest Posts
- Navigating the Market: Insights from Robin Griffiths and Ron William April 9, 2025
- Avoid Revenge Trading: The Key to Long-Term Trading Success March 31, 2025
- Mastering Relative Strength Portfolios: Key Takeaways from the March STA Meeting March 12, 2025
- Stay Disciplined, Stay Profitable February 26, 2025
- Understanding Price Gaps in Trending February 19, 2025


Latest Comments