Secondary Indicators: Skipped so often
How many roll up their sleeves in a hurry, study the price chart of their favourite financial instrument, using the same old methods and time frame, all the time. When questioned, the usual retort is that this is their preferred method, that it works well for them, and further discussion is useless. What a pity!
Surely one of the most exciting and greatest pleasures in life is learning new things and approaching analysis with fresh eyes; with the wonder of a child.
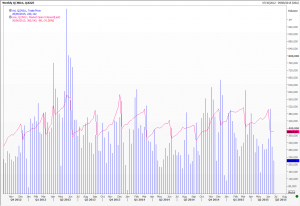
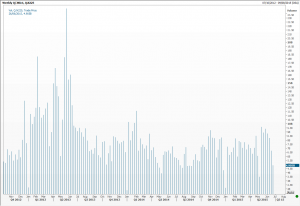
Recently I have forced myself into looking more closely at secondary indicators. Yes, things like volume – when available – are staples for many. But what about then comparing the volume in the cash market with that in the related futures contract, and again with the volume in certain options, whether puts or calls are more active and which of the strike prices. Add this together and it tells you an awful lot about where the fault lines lie.
Open interest is available in the futures market and, while we all know that it must be a zero sum game in that there are exactly as many buyers as sellers, the absolute levels matter and can be compared over time. Is this an instrument in vogue? And if so are too many getting too involved with stubborn, stale positioning?
Implied volatility, and the skew between puts and calls, different strikes and maturities, and what these imply for directional trades is another great indicator. Again you can see which way investors feel things ought to move and is especially useful when combined with opinion poll results.
Data on levels of margin debt, and in which securities, is published by some bourses. In Shanghai at the moment according to Bloomberg Business the selloff has been ‘especially painful for margin traders as their favourite stocks sink faster than the benchmark index’. Why does that not surprise me?
Recent data from the Tokyo Stock Exchange shows that foreigners, who now make up a good portion of the market, are nevertheless betting against the index – at record levels. Data complied since 2008 – and remember that some stock exchanges prohibit all short selling (for being unpatriotic or whatever!) – saw the short-selling ratio on the Nikkei 225 at a record 38.3 per cent, and 35.8 on the TSE generally. With data like this no wonder brokers are warning that June ‘could see the start of disappointment’ according to the Financial Times.
Do please write in if you have suggestions for other secondary indicators I should be following.
Tags: margin debt, open interest, short-selling, volatility, volume
The views and opinions expressed on the STA’s blog do not necessarily represent those of the Society of Technical Analysts (the “STA”), or of any officer, director or member of the STA. The STA makes no representations as to the accuracy, completeness, or reliability of any information on the blog or found by following any link on blog, and none of the STA, STA Administrative Services or any current or past executive board members are liable for any errors, omissions, or delays in this information or any losses, injuries, or damages arising from its display or use. None of the information on the STA’s blog constitutes investment advice.
Latest Posts
- Navigating the Market: Insights from Robin Griffiths and Ron William April 9, 2025
- Avoid Revenge Trading: The Key to Long-Term Trading Success March 31, 2025
- Mastering Relative Strength Portfolios: Key Takeaways from the March STA Meeting March 12, 2025
- Stay Disciplined, Stay Profitable February 26, 2025
- Understanding Price Gaps in Trending February 19, 2025


Latest Comments