Stupid spikes and Johnny-come-latelies : follow on from extreme rectangles (last week’s blog)
Almost 40 years ago I started on my quest to learn about derivatives markets and how to use technical analysis on their price charts. My ‘speciality’ – if one can call it that – was being a few steps ahead of others in really understanding the maths behind Eurodollar interest rate futures, which were due to open on the London International Financial Futures Exchange shortly. With a Hewlett-Packard scientific calculator and a phone line from London into the Chicago Mercantile Exchange, I was making a neat little pile arbitraging the dollar Libor rates in the City with futures prices in the States.
Part of my excellent training was a trip to see first-hand how the financial and commodity exchanges in Chicago and New York worked. Our broker took me one morning to the Eurodollar pit, and I was rather overwhelmed. I couldn’t work out what was going on, though I did realise the difference between the yellow-jacketed lackeys and the others. Left to my own devices I wandered off to the smaller adjacent trading room which housed some of the older commodity futures.
Founded in 1898 as the Chicago Butter and Egg Board, the CME still traded these but on electronic boards only. Nearby was a pit which traded random length lumber, first listed in 1969. Because it was slightly sleepy-hollow, I could see the separate steps involved in setting up a transaction. I was then taken for lunch at the seat-holders’ restaurant where I briefly met Leo Melamed. Both here and in New York I was warmly welcomed and think I was an object of curiosity: a European banker interested not just in trading but owning a seat or more on a futures exchange.
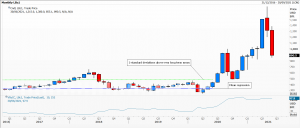
This preamble is a warning to all those who have been caught up in the wild gyrations over the last 3 months or so in that same lumber market. There are many reasons for the move, not least day-traders’ appetite for fast-moving, extreme price action; look at the monthly chart and calculate the potential carnage. An evening star 3-candle formation at a record high on record bullish momentum. What could possibly go wrong?
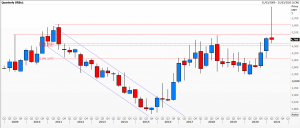
The quarterly chart (because we are nearly at the end of June) of steel rebar futures prices in Shanghai looks similar, leading many pundits to welcome in a new golden era for commodities prices – and the inflation they may bring. A giant shooting star candle at levels we’ve failed miserably at in the mid-2000s and again in 2011 was simply unsustainable.
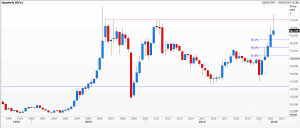
You’ll see similar patterns in copper (tumbling dramatically from a record high), eggs (yes, but the Chinese futures ones), palm oil, rice, canola and lean hogs.
But please don’t think these sort of moves are limited to commodity prices. Others with similar but far less dramatic moves include the Japanese bank Nomura and Deutsche Bank.
Tags: Excess, momentum, Speculation, Spikes, Stupid Moves
The views and opinions expressed on the STA’s blog do not necessarily represent those of the Society of Technical Analysts (the “STA”), or of any officer, director or member of the STA. The STA makes no representations as to the accuracy, completeness, or reliability of any information on the blog or found by following any link on blog, and none of the STA, STA Administrative Services or any current or past executive board members are liable for any errors, omissions, or delays in this information or any losses, injuries, or damages arising from its display or use. None of the information on the STA’s blog constitutes investment advice.
Latest Posts
- Navigating the Market: Insights from Robin Griffiths and Ron William April 9, 2025
- Avoid Revenge Trading: The Key to Long-Term Trading Success March 31, 2025
- Mastering Relative Strength Portfolios: Key Takeaways from the March STA Meeting March 12, 2025
- Stay Disciplined, Stay Profitable February 26, 2025
- Understanding Price Gaps in Trending February 19, 2025


Latest Comments