The laws of very small numbers: Translate into negative?
We all know that bear markets work differently to bull ones, whether you look at it from an Elliott Wave perspective (five phases on the way up but only three on the decline), patterns (blow-off tops versus rounded bottoms), and trends (neat steps up versus a slump). But do we pay enough attention to what happens at very low absolute price levels?
We understand how penny shares can double or halve in value daily getting a lot of media attention in the process. This was very much the case with bombed out banking stocks at the height of the financial crisis, exacerbated by the fact that so many people and institutions were shareholders. However, standing back a little and looking through the hype one will also see that rather than trending these lowly valued assets often trades in clear ranges.
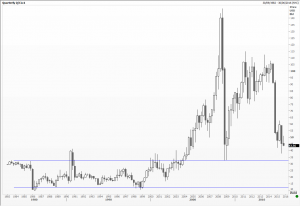
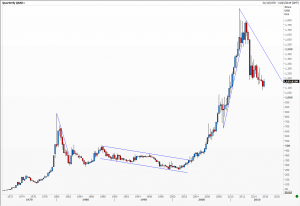
But what about instruments which have had, over the years, seen really big price moves. I am thinking of gold and crude oil, well known examples of liquid instruments that have multiplied in value many times, followed by really catastrophic reversals. As technical analysts, what can we expect at highs versus lows? The spot gold chart says it all, yet crude oil is quite different. Clearly when above $35 per barrel it has a tendency to wild swings, while seemingly happy in the $15 to $30 range.
But what happens when we cross the Rubicon into negative numbers? Not something we see very often, but we are currently dealing with negative nominal interest rates on a variety of financial instruments. What is interesting now is that the closer we get to zero, whether positive or negative, the smaller the absolute price moves and the greater the percentage ones – as with penny shares. The deeper we get into negative territory though the more price action resembles normal swings in positive territory. I have a feeling that this will become an issue many will struggle with.
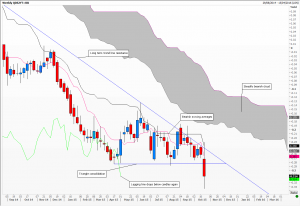
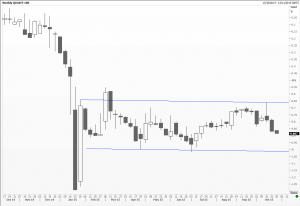
This week for the first time ever, and for a country that not a lifetime ago could not borrow beyond an eighteen month horizon, the Republic of Italy issued two-year BTP’s at a negative 2.3 basis points. They join a select few issuers who get paid to borrow money, as per the charts attached.
Tags: moving averages, oscillators, Point & Figure
The views and opinions expressed on the STA’s blog do not necessarily represent those of the Society of Technical Analysts (the “STA”), or of any officer, director or member of the STA. The STA makes no representations as to the accuracy, completeness, or reliability of any information on the blog or found by following any link on blog, and none of the STA, STA Administrative Services or any current or past executive board members are liable for any errors, omissions, or delays in this information or any losses, injuries, or damages arising from its display or use. None of the information on the STA’s blog constitutes investment advice.
Latest Posts
- Stay Disciplined, Stay Profitable February 26, 2025
- Understanding Price Gaps in Trending February 19, 2025
- Key Takeaways from a Fireside Chat with Perry Kaufman February 12, 2025
- The Power of Patience: How Waiting for the Right Setups Can Make or Break Your Trading Success February 3, 2025
- Mastering Market Trends: The Importance of Analysing Different Timeframes January 23, 2025


Latest Comments