US politics and cyclicality: cause and effect
Recent comments, comings, and goings at the US White House have been really too extraordinary for words. Vowing to clean up the Washington ‘swamp’, Donald Trump has collected a coterie of unusual candidates in his inner circle. So rather than two-party politics we now have what seems to be a bunch of experienced Republican hands with miffed, if not bloodied noses as they slug it out with the President’s friends and family.
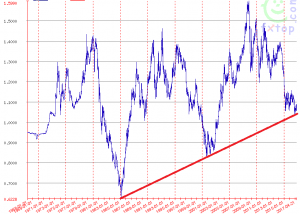
Thinking about this I remembered a paper written by Howard Friend a little while ago where he looked at the effect successive US Presidents had had on the value of the US dollar since 1969. ‘Assuming that the ‘party over President’ theme holds true…and that the core values of the Republican party are to dominate the major policy decisions going forward’ he lists the parties’ effect on the greenback. Using the EUR/USD exchange rate since 1999, and prior to that a currency basket that would have made up today’s euro, the swings are rather bigger than I would have imagined.
US heads of state take up office in January for a period of four years, can be re-elected for another four, but then that’s it. Gerald Ford started in August 1974 because Richard Nixon was impeached – he the man who had allowed the currency to float freely.
Political Party President Dates Dollar move
Republican Richard Nixon 1/69-8/74 -16.23%
Republican Gerald Ford 8/74-1/77 +2.23%
Democrat Jimmy Carter 1/77-1/81 -10.28%
Republican Ronald Reagan 1/81-1/89 +9.79%
Republican George Bush 1/89-1/93 -8.68%
Democrat Bill Clinton 1/93-1/01 +30.80%
Republican George W. Bush 1/01-1/09 -29.13%
Democrat Barack Obama 1/09-1/17 +24.72%
What immediately stands out is that pluses and minuses alternate, something one would expect with swings and roundabouts. Crunching the numbers he concludes that liberal high spending Democrats have on average seen a 15.07% appreciation of the US dollar while allegedly fiscally sound Republicans oversaw on average a 14.41% depreciation.
The chart he uses, courtesy of FXtop.com, is the value of a euro (basket) versus the US unit and shows that long term price trends run for between 76 months and 110. Rallies denote a stronger euro, declines a strengthening US dollar. He concludes that, as at January 2017, seeing as we had already witnessed 101 months of a strengthening dollar, plus were facing a Republican President, Congress and Senate, the chances of a weaker dollar over the next four years was high.
The full document has been published on Mr Howard’s LinkedIn page and can be accessed via this link http://bit.ly/2voN130
Or click EuroDollar
Describing himself as a trader, asset manager and trading system developer, he holds the CMT accreditation and lives in Switzerland.
The views and opinions expressed on the STA’s blog do not necessarily represent those of the Society of Technical Analysts (the “STA”), or of any officer, director or member of the STA. The STA makes no representations as to the accuracy, completeness, or reliability of any information on the blog or found by following any link on blog, and none of the STA, STA Administrative Services or any current or past executive board members are liable for any errors, omissions, or delays in this information or any losses, injuries, or damages arising from its display or use. None of the information on the STA’s blog constitutes investment advice.
Latest Posts
- Stay Disciplined, Stay Profitable February 26, 2025
- Understanding Price Gaps in Trending February 19, 2025
- Key Takeaways from a Fireside Chat with Perry Kaufman February 12, 2025
- The Power of Patience: How Waiting for the Right Setups Can Make or Break Your Trading Success February 3, 2025
- Mastering Market Trends: The Importance of Analysing Different Timeframes January 23, 2025


Latest Comments