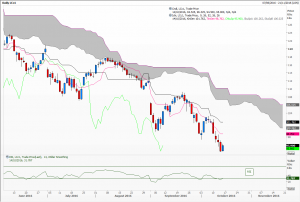
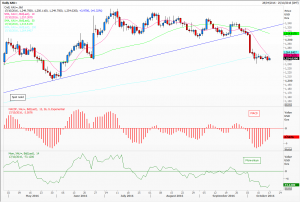
Will it keep going? And what about gravity?
An STA member very kindly sent me a link to an old but interesting article published in The Economist magazine. It gives details of studies conducted into the concept of momentum in financial markets and how to square this with the efficient market hypothesis and reversion to mean.
For those of you who are perhaps new to the debate one camp, usually dominated by economists, believes that ‘past performance is no guide to the future’ – a disclaimer used all the time in fund management literature. It believes that anomalies will even themselves out and that what goes up must come down again.
The second camp, to which technical analysis subscribes, posits that markets do move in trends and in cycles and that these can be observed and used profitably. Academics to pioneer studies in this field in the 1980’s were Belgian Werner de Bondt and Richard Thaler in Chicago. Since then ‘studies have repeatedly shown that, on average, shares that have performed well in the recent past continue to do so’, according to the magazine.
A fascinating long term study by Dimson, March and Staunton at the London Business School looked at the top 100 UK shares since 1900. Buying and holding the best 20 performers of the last 12 months, rebalancing the portfolio monthly, produced a 10.3 annualised improvement in performance than had one chosen the bottom 20 stocks. Similar results occurred in 18 of another 19 global markets they subsequently studied. The point here is that many subscribe to the idea that laggards must ‘catch up’, that they have ‘value’; obviously they don’t.
Some suggest the momentum effect exists because investors are slow to grasp a new reality, dragged reluctantly into taking prices to a new equilibrium; this is the lag between beliefs and what’s around the corner. The article says that the momentum effect allows investors to get rich slowly – but that many fund managers are impatient and use leverage to make a quick buck. As technical analysts we sympathise in that we too use tools to try and spot when a trend is slowing or is about to turn. The most obvious of these are trend lines and moving averages. We also have MACD, the momentum oscillator, RSI and Ichimoku clouds. All of which we’ve been using since well before 1980!
To read the full article (hopefully) please click here.
Tags: benchmarking, efficient markets, Memntum, reversion to mean
The views and opinions expressed on the STA’s blog do not necessarily represent those of the Society of Technical Analysts (the “STA”), or of any officer, director or member of the STA. The STA makes no representations as to the accuracy, completeness, or reliability of any information on the blog or found by following any link on blog, and none of the STA, STA Administrative Services or any current or past executive board members are liable for any errors, omissions, or delays in this information or any losses, injuries, or damages arising from its display or use. None of the information on the STA’s blog constitutes investment advice.
Latest Posts
- Fireside Wisdom: Clive Lambert in Conversation with Tony LaPorta September 10, 2025
- Understanding Triple RSI Divergence: A Potential Warning Sign for the S&P 500 September 1, 2025
- Unlock Your Potential in Finance: Join the Society of Technical Analysts – No Qualifications Required July 24, 2025
- Navigating Mid-2025: Inflation, Markets, Commodities & Strategic Outlooks July 10, 2025
- Why Your Post-Nominals Matter: MSTA & FTSA July 3, 2025


Latest Comments